As the operator of a successful marketing agency, you're always looking for ways to improve your team's productivity and streamline your processes.
That's why you implemented ClickUp, Teamwork, Monday.com or any other project management tool - to help your team work more efficiently.
But how do you know if your project management system is really making a difference for your agency? It seems to be helping the team, but how can you be sure?
To ensure that your investment in your project management platform is paying off, what metrics should you track to measure your team's efficiency?
At ZenPilot, we focus on three important project management metrics to understand how good our team is at planning and execution inside our project management system.
- Compliance Ratio - How well are we utilizing our team's capacity?
- Completed Ratio - How well is our team executing on planned work?
- Velocity Ratio - How aligned is our planning to our execution?
The better your team can predict the future, the healthier your agency will be. But to do so, you need to be able to analyze the past.
Take the Guesswork Out of Agency Profitability and Utilization
Stop making decisions with guesstimates. Get a glimpse into your agency's profitability and utilization.
Building Healthy Team Habits to Boost Agency Performance
You have the tool, and hopefully you've built your processes in the tool, but the last, and arguably the most important step to ensuring success in any project management platform, is building healthy habits across your team.
This is a HUGE part of the 1-3-5 Formula (our formula for a successful project management implementation) and a big part of building a better agency.
If your team isn't completing tasks, communicating well, filling out necessary fields or even using the system you've just built, your investment is NOT going to pay off.
There is a simple formula for this 👉 healthier habits = healthier data = better decisions.
Healthy habits need to be established at every level in your organization, starting with you 🫵.
- Executives lead by example
- Account and project managers work together to plan, deploy and assign work
- Individual contributors execute on that work
But first, let's take a step back and look at how these habits can help you achieve the goal you've been trying to accomplish.
How to Get Useful Data Out of Your Project Management System
Step #1: Better Inputs = Better Outputs
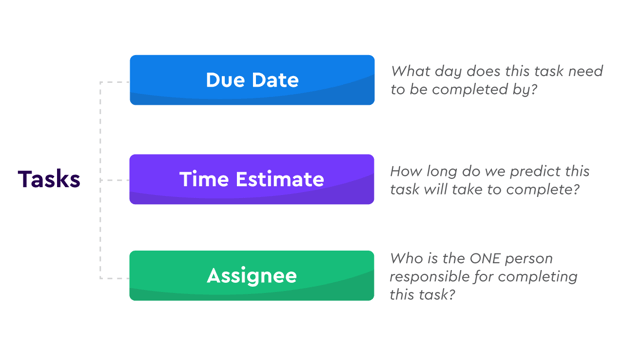
Before you can get any useful data out of your project management tool, you need to make sure you have three key ingredients on every task in your system.
- A Due Date - What day does this task need to be completed by?
- A Time Estimate - How long do we predict this task will take to complete?
- An Assignee - Who is the ONE person responsible for completing this task?
Having these three ingredients on every task in your project management platform is healthy habit #1. Your project and account managers should be responsible for this.
Step #2: Improve Planning & Execution
Aside from having the three key ingredients on every task, your project and account managers also need to prioritize and plan tasks well.
And your individual contributors need to execute on these planned tasks.
Execution begins and ends with your project management platform. Every tasks need to updated as work is progressed. This needs to be your single source of truth.
In fact, one of our Agency Project Management 10 Commandments is "If it's not in Teamwork or ClickUp, it didn't happen".
In order to make your single source of truth become a reality, we'd recommend:
- Implementing Workload Driven Project Management to keep work flowing smoothly across account managers, project managers and individual contributors.
- And assigning an internal champion to manage your project management system and hold the team accountable.
Now that we've talked all about healthy habits, let's discuss a few terms to help us understand a little bit more about what we're looking for so that we can start to measure our teams performance.
Understanding Work in Your Project Management System
Your team completed 500 tasks last week. Great! That's a step in the right direction, BUT was this actually a breakthrough?
From the outside it seems like it was, but we have no idea if any of that work was planned for this week. It could have been overdue work, random tasks that were due well into the future or even tasks without due dates (leaving us blind from knowing the planning and prioritization of that task).
If you want to have any confidence in your forecasting abilities and workload visibility, you need to understand more about the work that's in your system.
Take a look at the tasks in your project management system. Can you define and find these values on a weekly, monthly and quarterly basis?
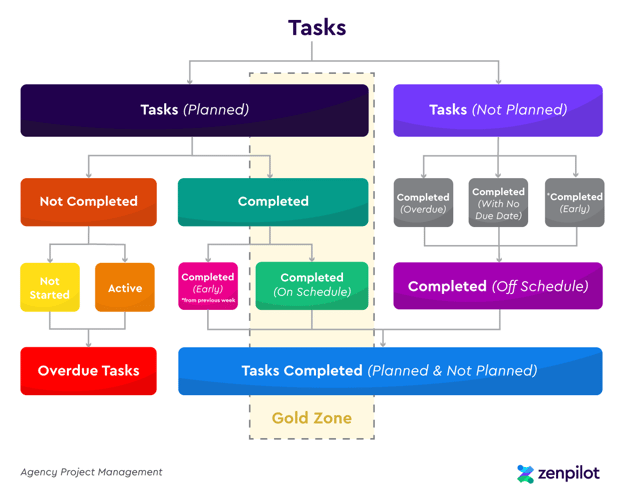
- Tasks (Planned) - These are the total number of tasks your project manager(s) planned this week. They have a due date set for this week.
- Not Completed - These are the tasks that were planned for this week, but weren't completed by the team. This is broken up into two categories:
- Not Started - These are the tasks that were planned for this week, but not started.
- Active - These are the tasks were planned for this week and were started, but not completed.
- Completed - These are the tasks that were planned for this week and completed. This is also broken up into two categories:
- Completed (Early) - These are the tasks that were planned for this week, but completed before this week. Your team completed the task far ahead of schedule. This isn't always a bad thing, but we want to make sure the team is sticking to the plan.
- Completed (On Schedule) - These are the tasks that were planned for this week and completed when they were scheduled.
- Not Completed - These are the tasks that were planned for this week, but weren't completed by the team. This is broken up into two categories:
- Tasks (Not Planned) - These are the total number of tasks your project manager(s) DID NOT plan this week.
- Completed (Off Schedule) - These are the tasks that were closed this week, but were either overdue, didn't have a due date on them, or had a due date in the future (outside of this week).
- Completed (Overdue) - These are the tasks that your team completed this week, but were overdue.
- Completed (w/ No Due Date) - These are the tasks that your team completed this week, but didn't have a due date on them.
- Completed (Early) - These are the tasks that your team completed this week, that were due in the future.
- Completed (Off Schedule) - These are the tasks that were closed this week, but were either overdue, didn't have a due date on them, or had a due date in the future (outside of this week).
- Tasks Completed (Planned & Not Planned) - This is the sum of your Completed (On Schedule) and Completed (Off Schedule) tasks.
If you read through that whole list and can't segment your tasks this way, book a call with one of our agency operations experts. THIS IS IMPORTANT.
Your goal (shown in the image below) should be to maximize the amount of work that is Planned and Completed (On Schedule). This is what we call the Gold Zone.
The more you agency moves in this direction, the better you'll be at forecasting.
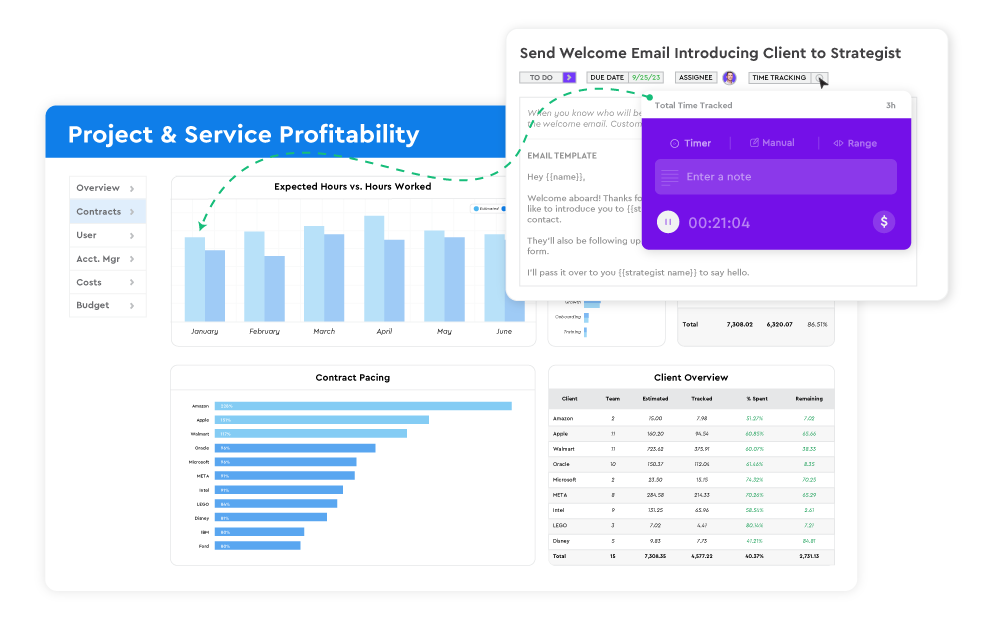
With a proper structure and hierarchy and a bit of advanced dashboard work, this information can be relatively easy to find.
In ClickUp, we build custom dashboards (shown below) to find this information. With their customizable cards, you're able to centralize all this data in one place, making it super easy to gather what you need.
How Do I Calculate My Agency's Project Management Performance Metrics?
There are a lot of prerequisites to successfully calculating your performance ratios. It takes time, work and patience.
But now that we've made it to this point, let's jump right in, starting with the Compliance Ratio.
1. Compliance Ratio
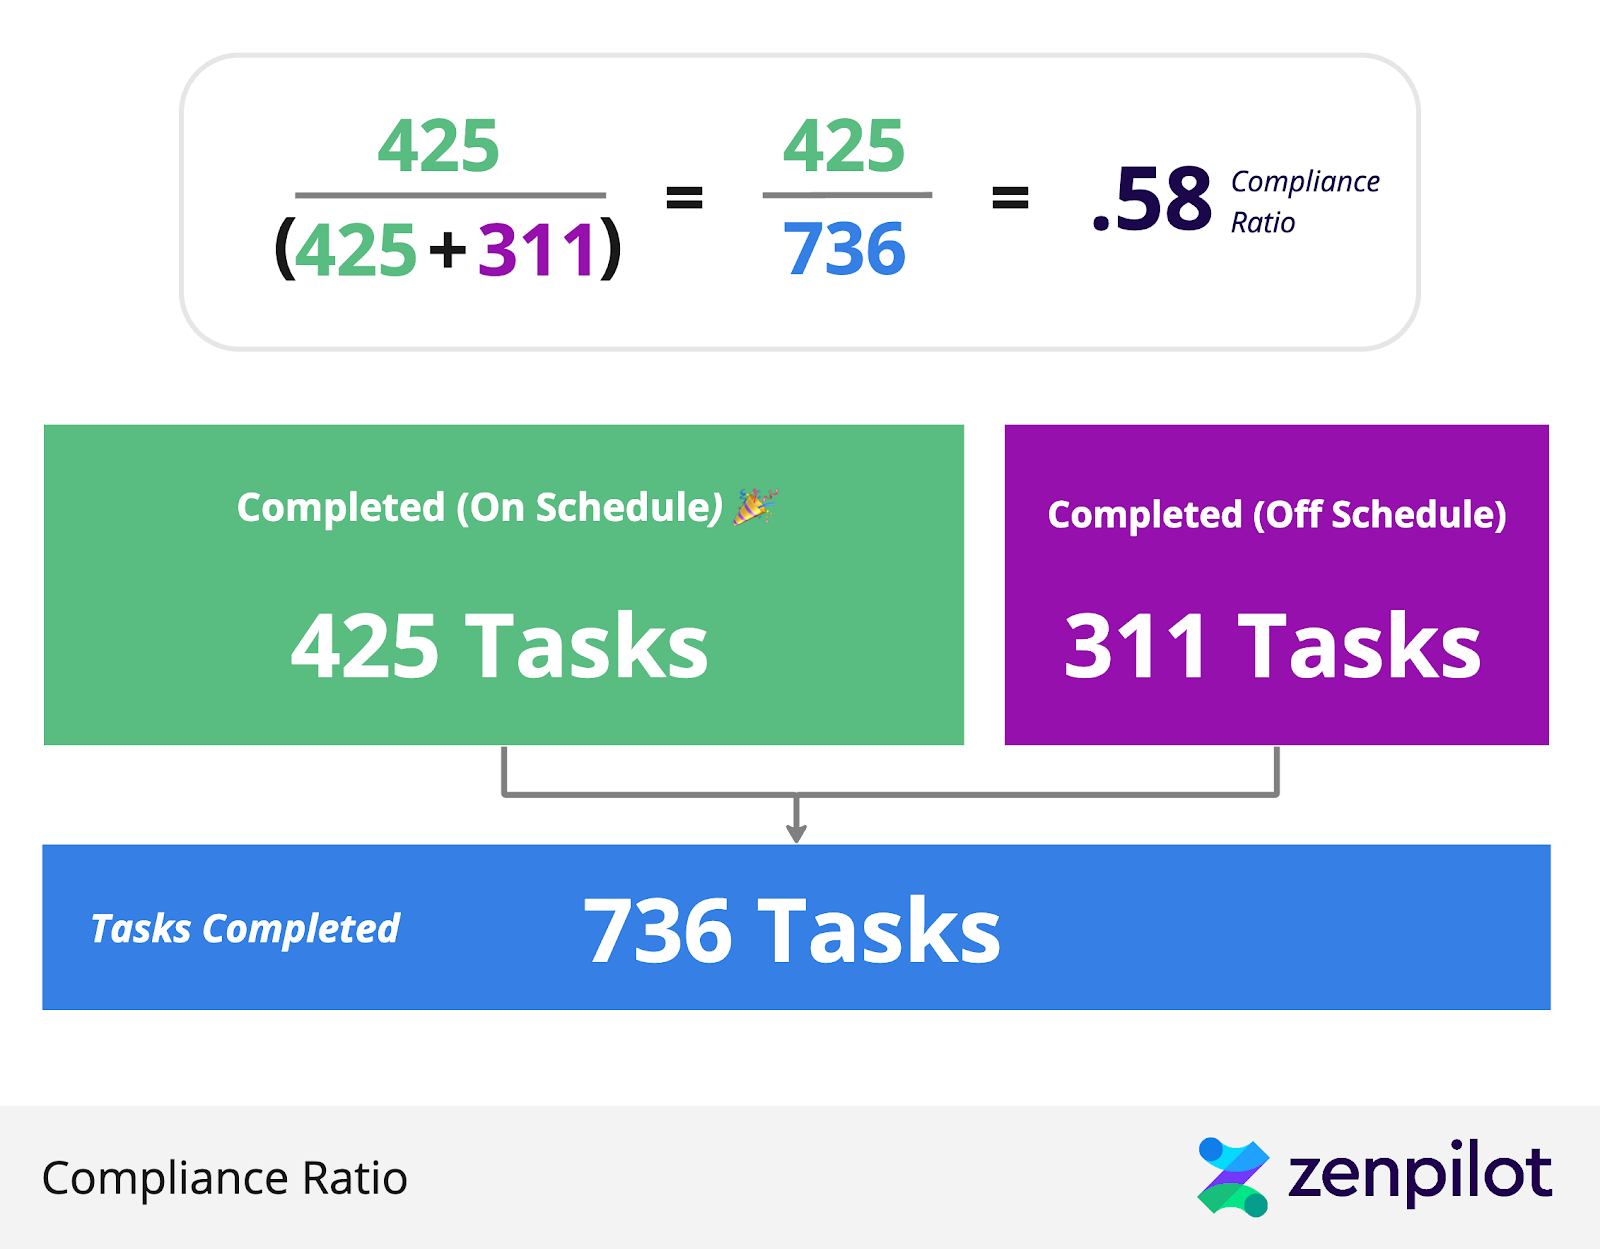
A Compliance Ratio measures your closed tasks - Completed (On Schedule) - against the total number of tasks that were closed that week - Tasks Completed (Planned & Not Planned).
Here's an example:
Your team closed 736 total tasks this week. Congrats! 🎉
BUT, they only closed 425 tasks on schedule.
The 311 additional tasks that were closed this week, were overdue, didn't have a due date or were completed ahead of schedule (not necessarily a terrible thing, but we need to focus on what's due this week first).
To calculate your team's Compliance Ratio we will:
- Take your Tasks Completed (On Schedule) - 425.
- And divide it by the Tasks Completed (Planned & Not Planned) - 736.
- 425/736 = a 0.58 Compliance Ratio.
As an agency, your goal is for your team to close 736 tasks (or more), but have all of these tasks be completed on schedule, not overdue, early or without a due date.
We completed a lot of work that needed to be completed, BUT, if you want to get better at scheduling work, the team needs to continue to make improvements.
2. Completed Ratio
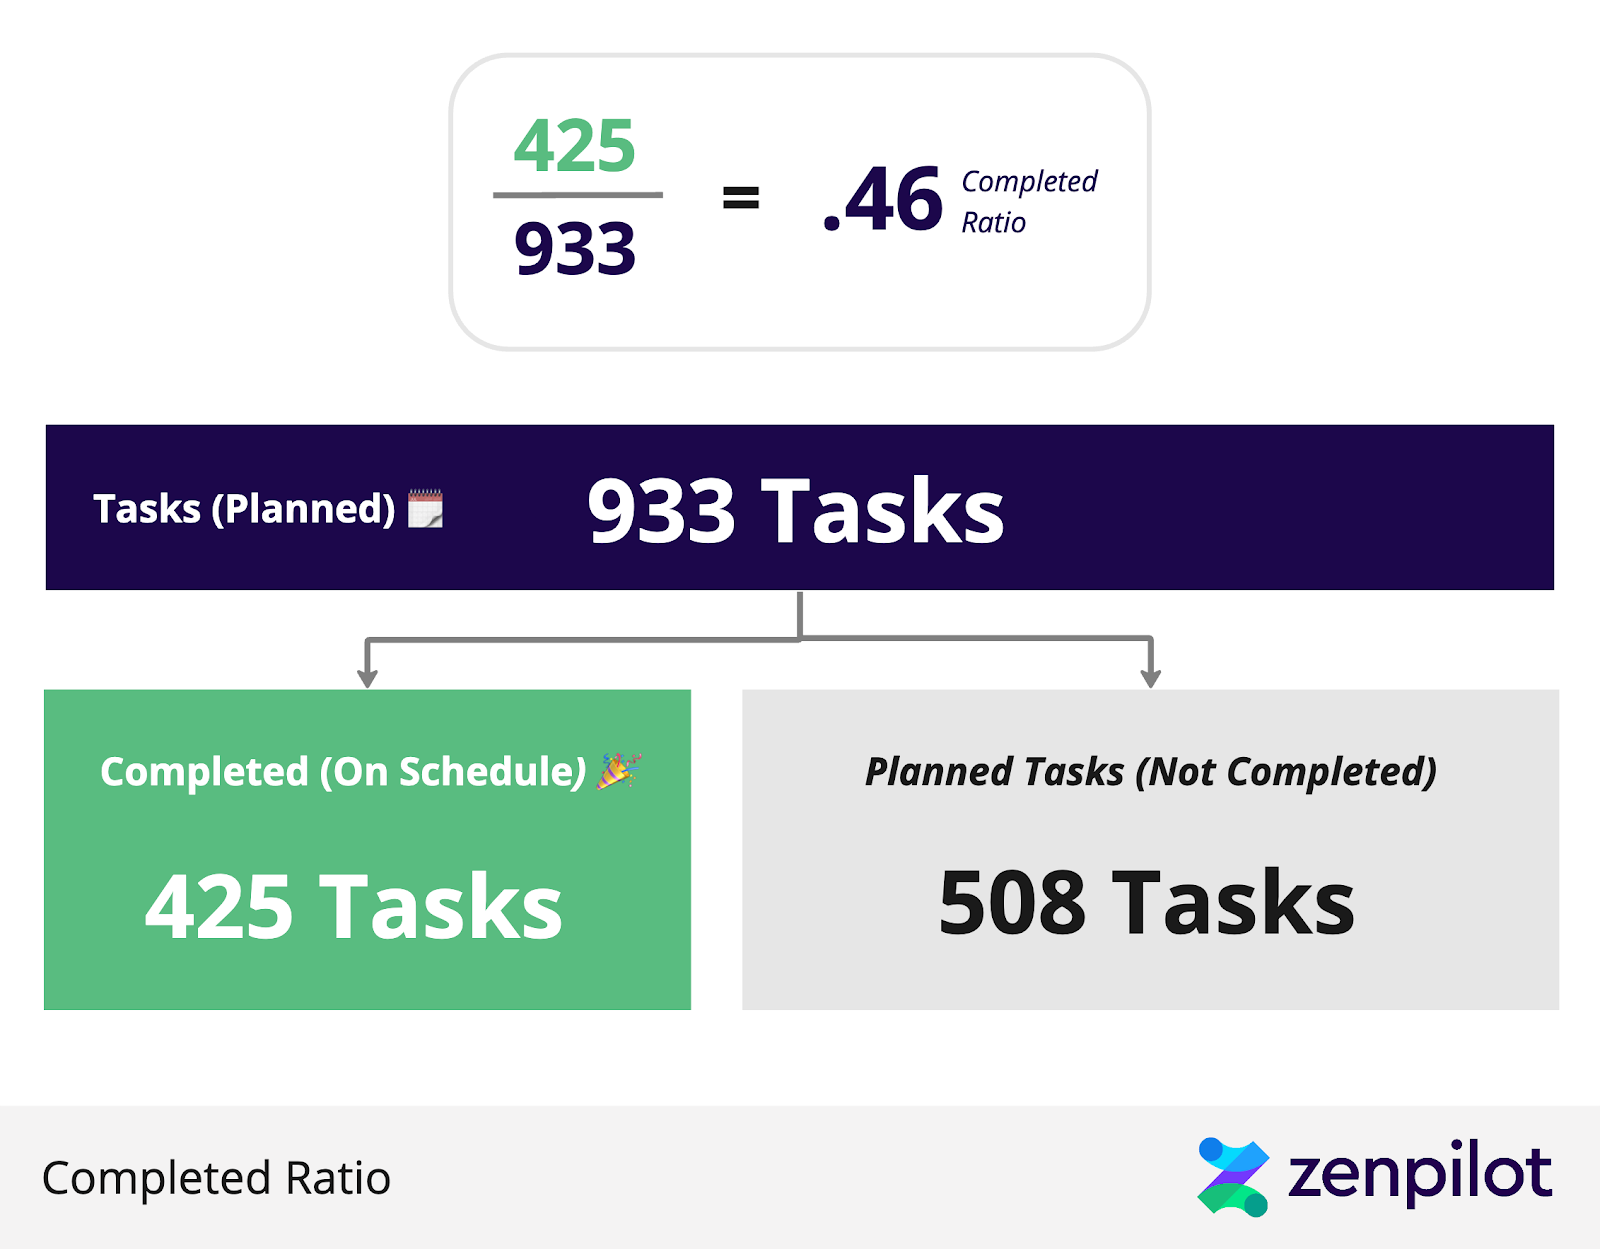
A Completed Ratio measures your closed tasks - Completed (On Schedule) - against the total number of planned tasks for the week - Tasks (Planned).
Here's an example:
Your project manager(s) discuss customer projects and priorities with the account manager(s) and schedule 933 tasks for your team to complete this week.
BUT, the team doesn't quite meet those expectations and they only finish and close 425 tasks out of the 933.
To calculate your team's Completed Ratio we will:
- Take your Tasks Completed (On Schedule) - 425.
- And divide it by - Tasks (Planned) - 933.
- 425/933 = a 0.46 Completed Ratio.
As an agency, your goal is for your team to plan 933 tasks, and have all of these tasks be completed on schedule.
3. Velocity Ratio
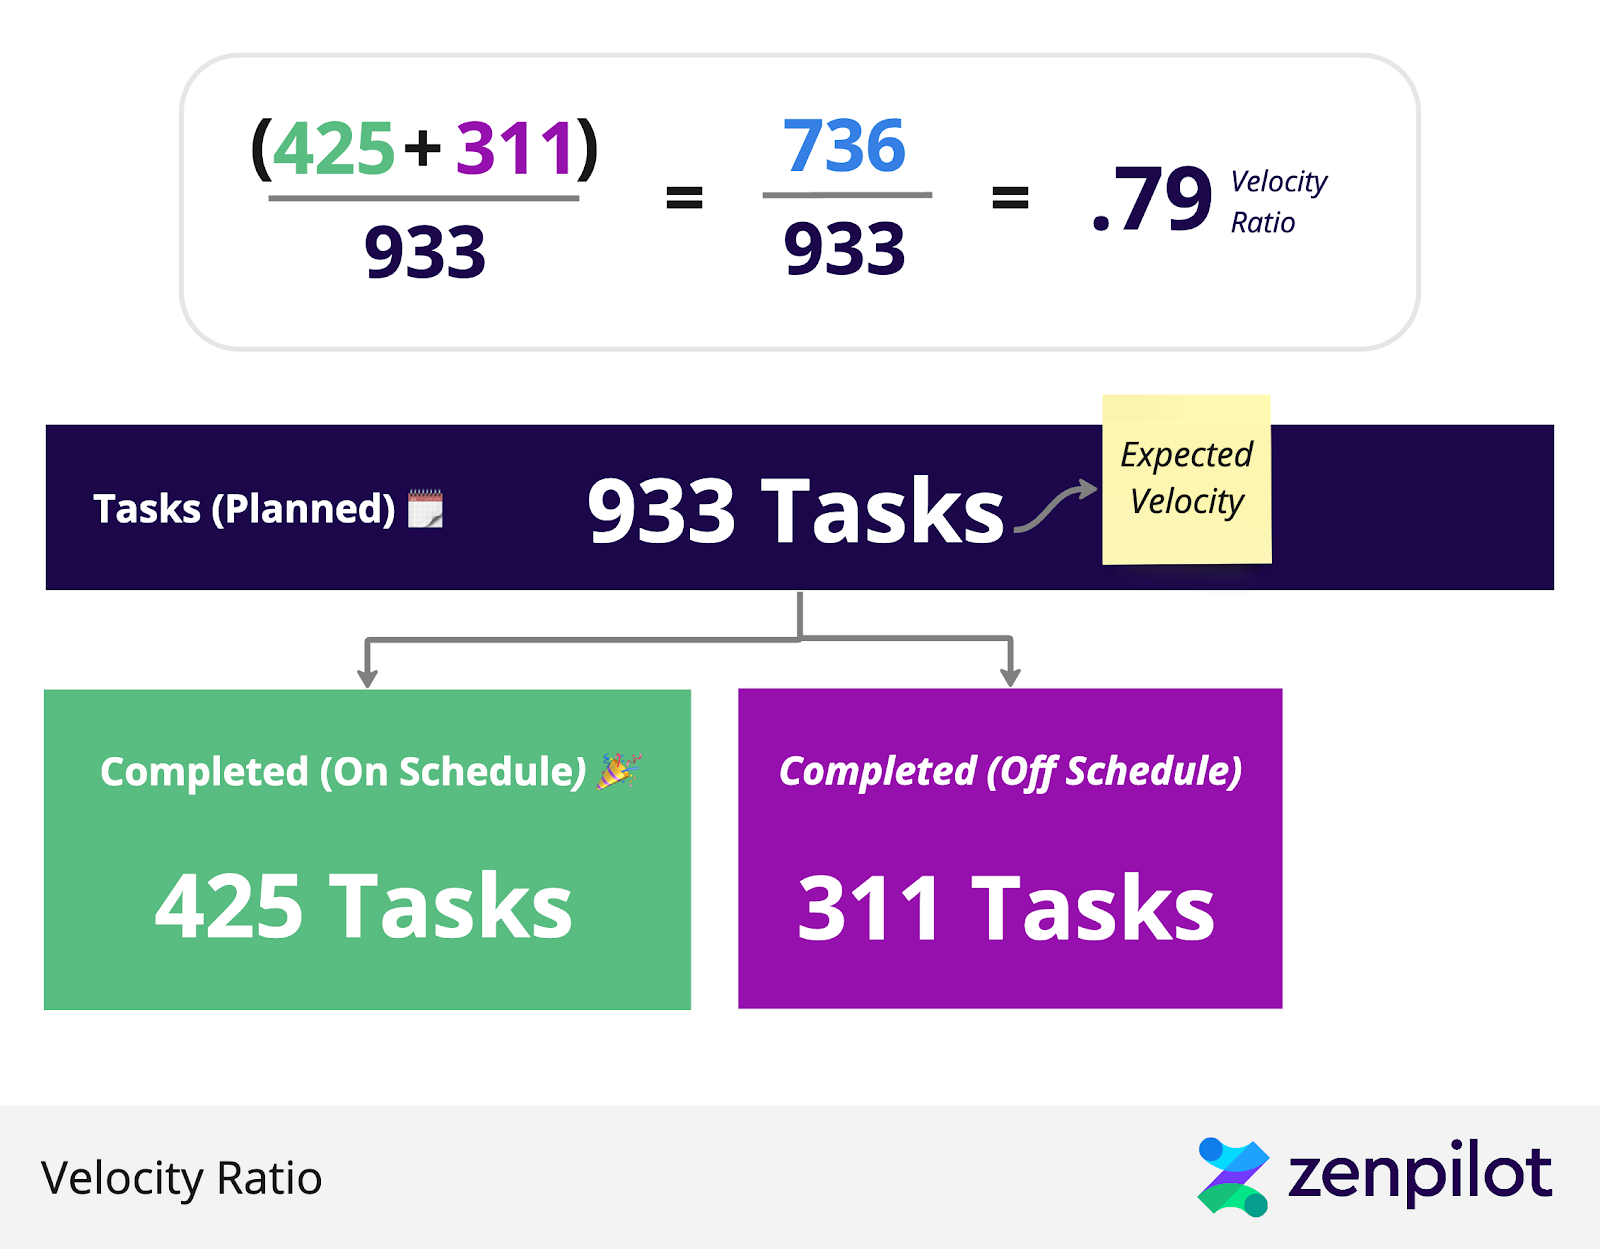
A Velocity Ratio measures the total amount of tasks your team closed - Tasks Completed (Planned & Not Planned) - against the total amount of tasks your project manager scheduled - Tasks (Planned).
Here's an example:
Your project manager(s) discusses customer projects and priorities with the account manager(s) and schedules 933 tasks for your team to complete this week.
BUT, the team deviates from the plan slightly. They complete 425 of the total 933 planned tasks, but also complete 311 other tasks that were NOT planned for this week.
To calculate your team's velocity we will:
- Take your team's True Velocity/Tasks Completed (Planned & Not Planned) - 736.
- And divide it by Tasks (Planned) - 933.
- 736/933 = a 0.79 Velocity Ratio.
As an agency, your goal is for your team to plan 933 tasks, and have all of these tasks be completed on schedule.
BUT, in this ratio, we are also including unplanned tasks that were closed. If we are able to complete more tasks than what our project manager(s) scheduled, our team is able to take on more work than what is being assigned, and vice versa.
How Do I Calculate My Company's Overall Efficiency Score?
After you've found your Compliance, Completed and Velocity Ratios, you can calculate your weekly score. This will help benchmark your agency's performance and enable you to analyze the past to predict the future.
The formula is weighted heavier towards both the completed and compliance ratios. Here is how we calculate the weekly score:
- (Completed Ratio)*(0.35)
- (Compliance Ratio)*(0.35)
- Velocity Coefficient
- If the Velocity Ratio is > 1, then (-1*(Velocity Ratio - 1)*0.3) + 0.3)
- If the Velocity Ratio is < 1, then (Velocity Ratio)*(0.3)
Formula = ((Completed Ratio)*(.35)) + ((Compliance Ratio)*(.35)) + (Velocity Coefficient)
In our example above our company score would be 0.60
- (0.58)*(0.35) = 0.20
- (0.46)*(0.35) = 0.16
- (0.79)*(0.3) = 0.24
(0.20 + 0.16 + 0.24) = 0.60
Your goal should be to get this number as close to 1 as possible.
The closer your score is to 1, the better you're able to close a new project with confidence, knowing that your team has the capacity to knock it out of the park.
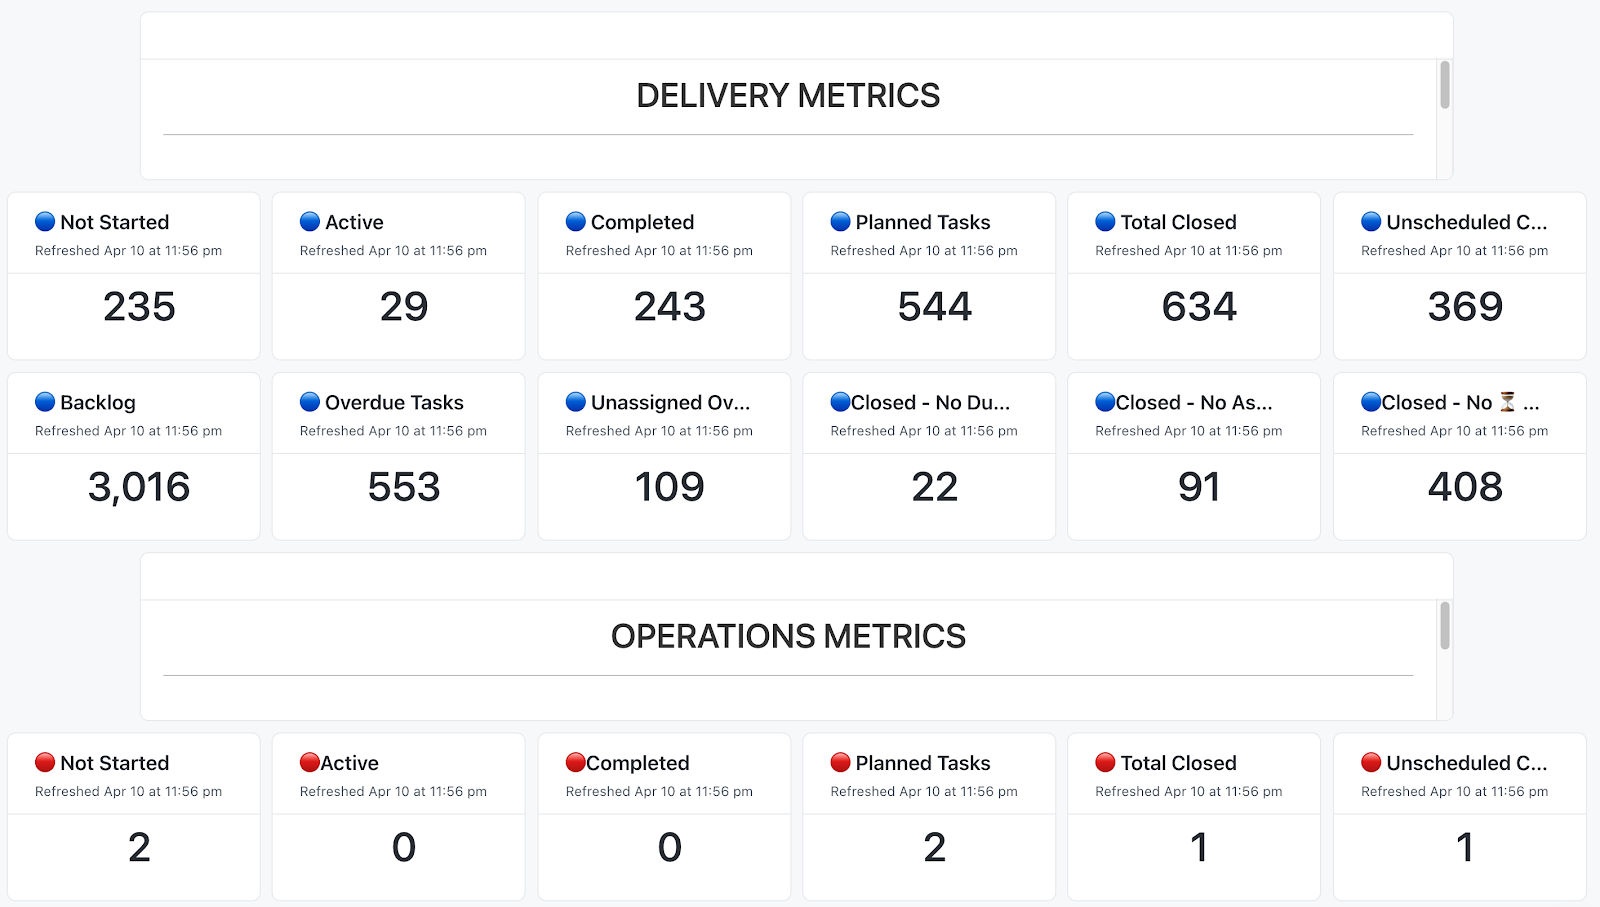
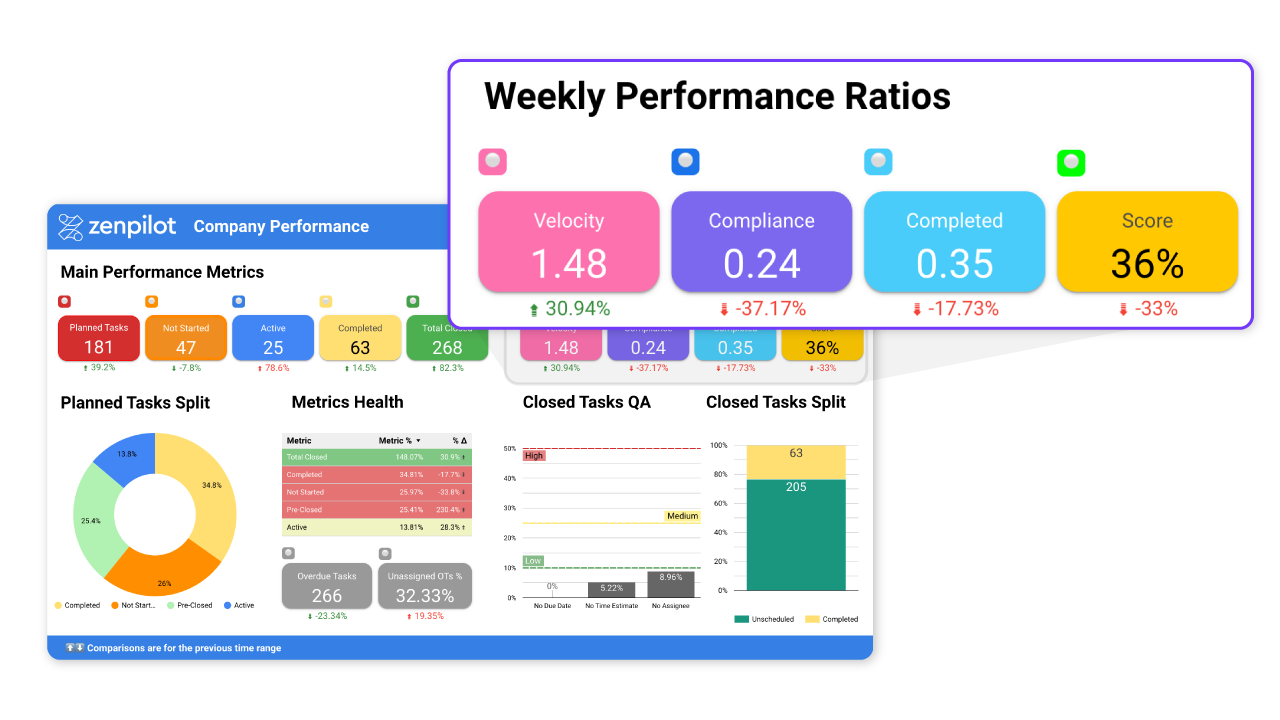
Below is a report that our amazing Solutions Team sends to our partners. On a weekly basis, our team monitors these metrics and offers solutions to aid teams in achieving their objectives. Schedule a call with us if you'd love to get this kind of visibility and reporting.
See This Report in Action
During one of our live streams, our Solutions Lead Alex Rizea screenshared a report summarizing the three ratios + company score.
Have a look:
I've Calculated My Efficiency Score - What's the Next Step?
Your company score can help answer these questions - helping guide your forecasting decisions.
- Did we schedule too much?
- Did we schedule too little?
- Did are team execute on the plan?
In a perfect world, every ratio would be 1, but that'll take an agency full of insanely productive people. That should be your goal, but lets be realistic.
Let's look at three realistic agency scenarios to help you compare and contrast your current situation.
Three Different Agency Scenarios and Conclusions to Guide Your Decisions
Scenario 1:
- Completed Ratio = 1.00
- Compliance Ratio = 0.77
- Velocity Ratio = 1.30
- Company Score = 0.83
Conclusion: The team completed all 1,000 tasks that were planned! This is fantastic. However, our compliance ratio and velocity ratio are showing that the team also completed 300 additional tasks that were not scheduled for this week. This shows your project managers that the team has extra capacity to take on some more work!
Scenario 2:
- Completed Ratio = 0.30
- Compliance Ratio = 0.38
- Velocity Ratio = 0.80
- Company Score = 0.24
Conclusion: The team only completed 30% of the tasks that were scheduled and completed 500 other tasks that weren't scheduled for this week. And our velocity ratio is showing us that they didn't even close 1,000 tasks. Your project managers may need to slow down on the assignments and look at where the 500 additional tasks are coming from.
Scenario 3:
- Completed Ratio = 0.85
- Compliance Ratio = 0.85
- Velocity Ratio = 1.00
- Company Score = 0.60
Conclusion: The team only completed 85% of the tasks that were scheduled, but also completed 150 additional tasks. This isn't quite as good as Scenario 1, but it's a step in the right direction. Your project managers did a great job in forecasting your team's velocity, but they need to work to minimize tasks that are completed (off schedule).
The Only Fully Guaranteed Agency Operations Improvement Framework
Get 360 clarity into your operations or your money back, guaranteed.
How Can I Achieve This Level of Clarity at My Agency?
Clarity is at the heart of our 1-3-5 Formula. It's the ultimate objective that every agency strives to attain. Every conversation we have with agency owners and operators is around achieving clarity, whether it's at the top or bottom of the organizational hierarchy.
Streamlining your operations in a project management tool is only the beginning of your journey into clarity. You've now been given the key to a world full of data and knowing what to measure and track is another massive step into clarity.
Keep optimizing what you've built. Build new workflows, automate repetitive tasks, and improve your forecasting abilities. You're in an excellent position to succeed.
Our team lives for helping agencies continue to optimize and streamline their operations.
If you're looking for a strategic partner to:
- Ideate, build a manage automations that'll save you hours of work per week
- Provide all the reporting, analysis and next steps you'll need to improve your forecasting.
- Build operational solutions in Teamwork or ClickUp that most agencies dream about (ex. Workload management suite, Contract management, Freelancer management, Account management dashboards, etc.)
- Be your Teamwork or ClickUp champion to hold your team accountable and help them build healthy habits.
We are here for you.
Book a call and let us bring your agency operations to the next level. 😎
Turn Chaos Into Clarity.
We're your agency operations pilot.
You can build a happier, more productive, more profitable team with ClickUp. We'll show you how.