When it comes to growing your agency, data-driven decisions can mark the difference between success and failure. You wouldn’t run a marketing campaign without tracking traffic, conversion rates, and social engagement, so why scale an agency without tracking KPIs?
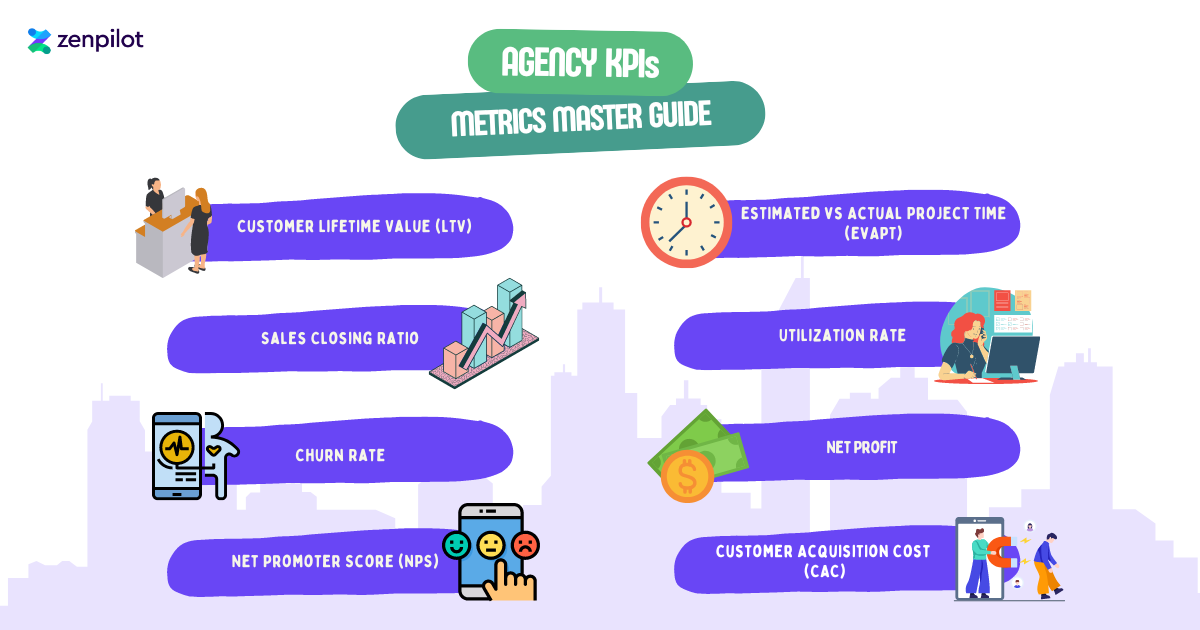
In this master guide, we’re going to go over eight of the most important KPIs that every agency owner should keep an eye on.
We’ll also touch on a few strategies that can help you improve your metrics by increasing customer lifetime value, reducing churn, and a lot more!
Join 9,360+ agency leaders improving their agency ops, culture, and results. Subscribe
What Are KPIs?
KPIs or key performance indicators are a form of performance measurement. KPIs help you track the success of a company, organization, or team in specific activities and campaigns.
Customer Lifetime Value (LTV)
The first metric you should look at is your customer lifetime value or LTV. If you don’t know how much money each client is generating for your agency then you’ll struggle to make the right decisions when it comes to advertising and marketing.
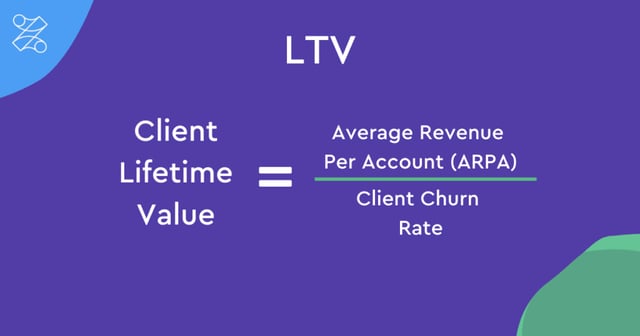
We’ve seen far too many cases of agencies who end up with a negative return on their paid ads or content strategy because they didn’t measure their LTV beforehand. The good news is that calculating your customer lifetime value is actually quite easy.
All you need to do is take your average revenue per account (ARPA) and divide it by your churn rate. This will give you the average amount of revenue that you can expect from your customers over the lifetime of the business relationship.
That said, how do you actually increase LTV? Well, there are generally two approaches: upselling and cross-selling. If you’re a content agency then upselling could come in the form of producing twice as many articles in exchange for a larger retainer fee.
Cross-selling, on the other hand, centers around selling additional products or services that are related to your core offer. By increasing the value provided with social media management, PPC consulting, SEO audits, and other cross-sells you’ll naturally get more revenue in the long run.
However, you should avoid cross-selling too soon though as clients might think you’re trying to nickel and dime them for all they’ve got. Instead, find the right time to upsell such as right after a campaign milestone where the client has already seen the ROI from working with you.
Sales Close Rate
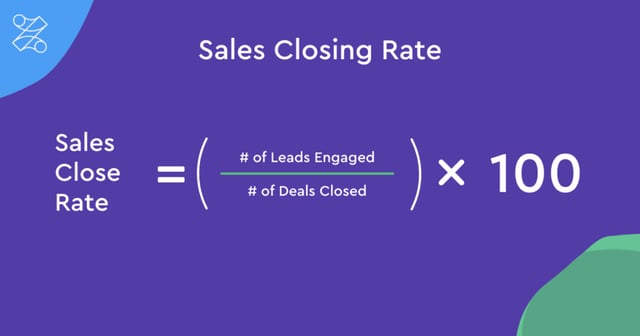
The sales close rate compares the total number of leads that your team engaged with versus the number of deals that were actually closed. Like other conversion metrics, this KPI can measure the effectiveness of both your sales funnel and sales team.
The sales close rate measures the number of prospects engaged by your sales team compared to the number of deals won. This conversion ratio is designed to analyze the effectiveness and duration of your sales funnel.
If your closing ratio is too low then that could mean too many unqualified leads are reaching the bottom of your funnel or the sales team isn’t using the right strategies to seal the deal. In the former case, you should make an effort to filter out unsuitable prospects.
You could do this by niching down, listing transparent pricing on your website, or having prospects reach out via a contact form instead of letting them book a call on your calendar from the get-go.
If closing deals is the problem then here are some things to keep in mind:
- Learn to listen. It’s easy to get carried away talking about the benefits of working with your agency or the results you’ve achieved for other clients. There’s nothing wrong with playing on your strengths and mentioning social proof, but it shouldn’t come at the cost of actively listening to your clients and giving target responses.
- Answer questions. Questions (both inbound and outbound) can make or break your sales close rate. That’s why it’s important to never dodge a question, even if it’s a topic you’re trying to avoid. Prospects almost always catch onto this and not answering a question at all is the only thing worse than answering it poorly.
- Ask questions. Asking the right questions can also be the perfect way to establish your expertise and close deals on the spot. Seemingly simple questions like “what timeline were you looking for to get this set up?” or “are there any other team members we should check with to finalize the decision?” can make a world of difference.
Churn Rate
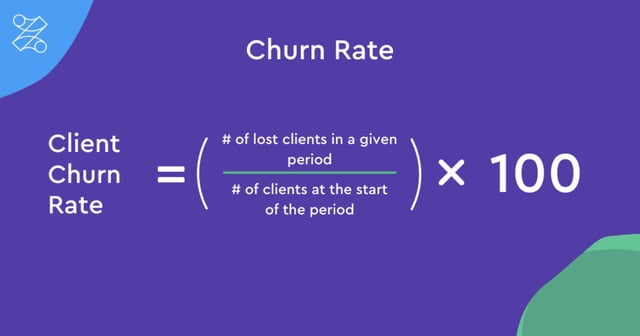
Also referred to as client turnover, your churn rate is the rate at which customers stop doing business with your agency. There can be a number of factors contributing to churn but establishing a healthy baseline is the best starting point to figure out what’s going wrong.
Project-based agencies can survive or even thrive on churn rates of 30% to 50% annually as long as they have enough leads coming through the pipeline. However, retainer-based agencies that rely on a recurring revenue business model need to keep their churn rate a lot lower.
Generally speaking, seeing a churn rate of 20% or higher should be a red flag since it could indicate issues that will put other retainers at risk. If your churn rate has slowly crept up over the years or spiked in recent times, there are a few things you can do to aid in retention.
First of all, you should follow up on any negative feedback you might be receiving from clients so you can address potential issues before they churn. Increasing transparency when it comes to campaign results can also help them grasp the ROI.
You should also ask for feedback more often so you’re always up to date on how the client is feeling about the collaboration. In fact, going the extra mile with a dedicated client success manager could help you retain the highest-value contracts for longer.
If you want to learn more about client success, optimizing for retention, and keeping customers for years instead of months then be sure to watch our interview with Ben McLellan on the Agency Journey podcast.
The main drawback of using churn rate as a basis for customer satisfaction is that you likely won’t know there’s a problem until it’s too late. If you want to transcend the reactive nature of churn rates, there’s another metric you could be looking at…
Net Promoter Score (NPS)
While tracking your churn rate is undoubtedly important, there are certain benefits that can only be achieved using NPS data. The net promoter score metric is responsible for tracking the likelihood of referrals and, by extension, general customer satisfaction.
Looking at churn rates can tell you that there’s a problem in the client journey but only after you’ve lost enough customers to notice the trend. In contrast, the NPS metric makes it possible to proactively address potential friction points or objections before clients churn.
Declining net promoter scores are never a pretty sight to see but at least you have time to course-correct whereas churn data is more about accepting your losses and carrying out damage control to make sure history doesn’t repeat itself.
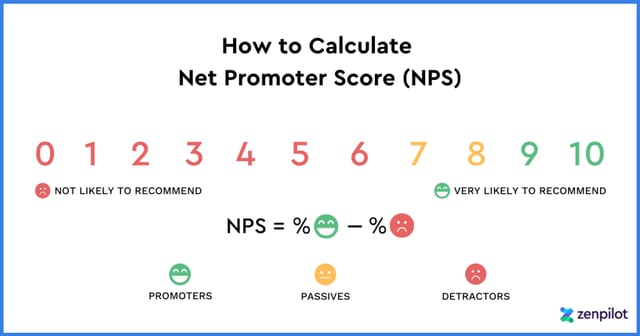
To calculate your net promoter score, you’ll need to ask clients how likely they are to recommend your agency to a friend or colleague on a scale from 0 to 10. You’ll then aggregate the responses to see how many promoters and detractors you have.
Anyone rating a six or lower is considered a detractor, those who respond with a 9-10 are promoters, and respondents in between are labeled passives which means they’ll be excluded from the calculation.
Finally, it’s time to subtract the percentage of detractors from the percentage of promoters. Your net promoter score can range between -100 to 100 depending on how satisfied your clients are — with anything above 0 indicating that you have more promoters than detractors.
Bain & Company, the creators of net promoter scores, offer the following benchmarks:
- Above 0 = good
- Above 20 = favorable
- Above 50 = excellent
- Above 80 = world-class
It’s worth noting that getting a 100 is almost impossible and even companies with dedicated fanbases like Apple have only achieved a 47. Wells Fargo, a company worth hundreds of billions of dollars, has a net promoter score of -2.
This shows that there’s always room for improvement whether you’re a startup, mid-sized agency, or tech giant. To learn more about the importance of a good net promoter score and how to implement it in your agency, watch our interview with Amber Mackay.
Estimated vs Actual Project Time (EvAPT)
The EvAPT is a powerful metric for tracking internal efficiency and how close your team members are sticking to deadlines. Constantly being behind schedule will negatively impact employee morale, client satisfaction, and retention rates.
Conversely, staying true to the projected timeline on most campaigns will boost productivity since there’ll be less cramming and your clients will also be more likely to work with the agency again in the future (or send referrals!)
ClickUp’s native time tracking features let users set a time estimate for every task but also use the time tracker to see how long it actually takes them to complete. This is a simple but effective way to keep your team accountable and identify any points of friction in your agency’s workflow.
Similarly, you should also analyze the estimated cost for every project and compare that to the actual amount spent to see if there are any expenses that your initial proposals don’t account for.
Utilization Rate
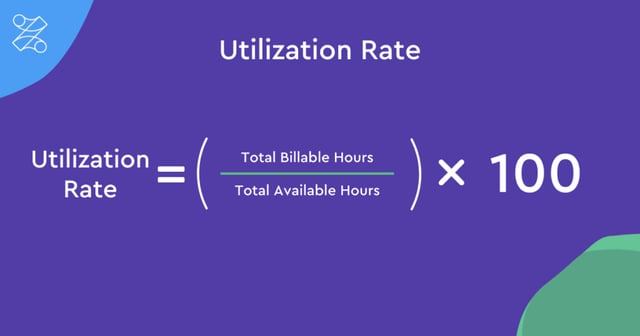
In a nutshell, utilization is the percentage of an employee’s available time used on billable work. This metric not only helps you gauge the efficiency of your team but also measures whether or not your agency is billing enough to cover overhead costs.
Calculating the utilization rate is actually quite easy since all you have to do is divide the total billable hours by the total number of hours available to that employee to get your final percentage.
If you want to increase your agency’s utilization rate, there are a few steps you can take. Automating repetitive tasks like meeting scheduling, email management, or other administrative activities could help your employees focus on high-value work instead.
Another approach would be to be more diligent in your time tracking software to ensure billable hours aren’t falling through the cracks. It’s worth noting that this only applies to agencies that bill by the hour though.
Agencies that get paid by the project shouldn’t implement excessive time tracking policies as this could actually just add on to the amount of admin work that employees have to do which lowers the utilization rate.
Increasing the number of sales leads and improving delegation on the project management front can also ensure that all your employees are actively working on valuable tasks rather than sitting idle with “bench time.”
Net Profit
At the end of the day, it’s crucial that you maintain a healthy net margin. VC-funded tech companies like Amazon or Uber are well-equipped to sustain a high burn rate for years but the same can’t be said for most agencies.
Calculating your net profit just comes down to taking your total revenue and subtracting your total expenses. If net profit is coming in lower than you’d hoped then it could be due to excessive spending, not enough sales, or a combination of the two.
To calculate your profit in the form of a net margin, take your net profit then divide it by total revenue before multiplying it by 100. In either case, there are multiple tried-and-tested methods of increasing the net profit of your agency.
One approach would be to reduce your CAC (more on this below) so your margins are higher for each new client. You should also revisit utilization to see if it’s possible to increase the revenue generated by certain employees.
Finally, creating processes or templates for specific client types will reduce the amount of time and money you need to spend on each campaign. This also makes it possible to establish yourself as an expert in the niche and charge higher rates for your services.
Customer Acquisition Cost (CAC)
Finally, you need to know your customer acquisition cost since this can be weighed against the customer lifetime value to get your LTV:CAC ratio. Staying on top of your customer acquisition cost is also essential for calculating net profit and maintaining healthy margins.
While the CAC is never exact, the metric is able to calculate the estimated cost of acquiring new clients for your agency. The most basic method of calculating it would be to divide your gross marketing spend by the total number of new customers you acquired over the same period.
Fortunately, there are quite a few ways to decrease your CAC:
- CRO. Conversion rate optimization on your landing page and sales process can help you close a greater percentage of inbound leads which brings your CAC down as a result.
- Organic Traffic. Paid ads in the form of pay-per-click marketing are often one of the largest contributors to a high CAC. By generating more organic traffic with content marketing and SEO, you’ll be able to reduce your ad spend which in turn lowers CAC.
- Productization. Productizing your services into a subscription model will bring down your CAC since you’ll be able to work with clients on a long-term retainer instead of needing to find new customers on a regular basis.
- Pareto Marketing. If your CAC is too high, you should consider applying the 80/20 rule to future marketing campaigns. Identifying the channels that bring in 80% of new clients will help you make results-driven budget decisions and trim off low-ROI endeavors.
- Negative-Cost Campaigns. Implementing affiliate revenue or info product sales into certain marketing campaigns can bring in supplementary revenue that subsidizes some of the acquisition costs.
Conclusion:
As you can see, there’s no shortage of internal and external KPIs to track. It all comes down to what you’re trying to achieve. If retention is a problem then looking at your NPS feedback, EvAPT, and churn rate over time could help you pinpoint the issue.
In the same way, agencies that are concerned about cash flow can look into increasing their client LTV with upselling or increasing their utilization rate to achieve healthier net margins. Regardless of what you’re tracking, always check that your data is accurate and actionable.
If you want to learn more about increasing your agency’s efficiency and profitability then check out some of our interviews from the Agency Journey podcast!