Stop Leaking Money: Gain Clear Visibility Into Utilization and Profitability Using ClickUp Data

Recently I had the pleasure of hosting Andrew Dymski, Co-founder at ZenPilot, for a live stream demo and Q&A on our new reporting solution, ZenPilot Profitability & Utilization Reports.
We know all too well the constant agency struggle to understand exactly how your team is performing and whether you're maximizing profitability across clients.
It's frustratingly difficult to piece together data from multiple sources to get a clear picture.
So we decided to build a solution.
It's a layer of data visualization built in PowerBI on top of ClickUp data...
...and it finally gives agencies clarity into where they're getting the biggest profits (or losses!) across clients, service lines, verticals...and even account managers.
When I got the green light to finally start sharing far and wide about our new unified reporting suite for ClickUp, I knew a live stream was in order.
I was thrilled to sit down with Andrew to grill him on ZP Reports and report back to you, dear reader.
For a summary of the stream, read on!
What Key Metrics Are Missing From Your Current Reporting?
I started off the live stream by asking viewers to share their current reporting challenges. Here were some of the biggest issues mentioned:
- Data living in multiple places - QuickBooks, Harvest, Excel, etc. Difficult to consolidate.
- No visibility into team utilization rates.
- Tracking time outside of ClickUp, meaning no connection to tasks and projects.
- Inability to analyze profitability by service line or client.
- No centralized place for out-of-office and availability data.
Andrew confirmed that many agencies struggle to get these insights natively from ClickUp or other tools. The data either doesn't connect properly or doesn't exist at all.
But with the right structure and habits, you can unlock tremendous visibility.
How Does ZP Reports Uncover Issues and Optimize Agency Operations?
Andrew then gave us an in-depth demo of the new ZP Reports dashboard (here is the exact timestamp when the live demo starts) and how it provides the missing metrics agencies desperately need.
Here are some of the key views he showed:
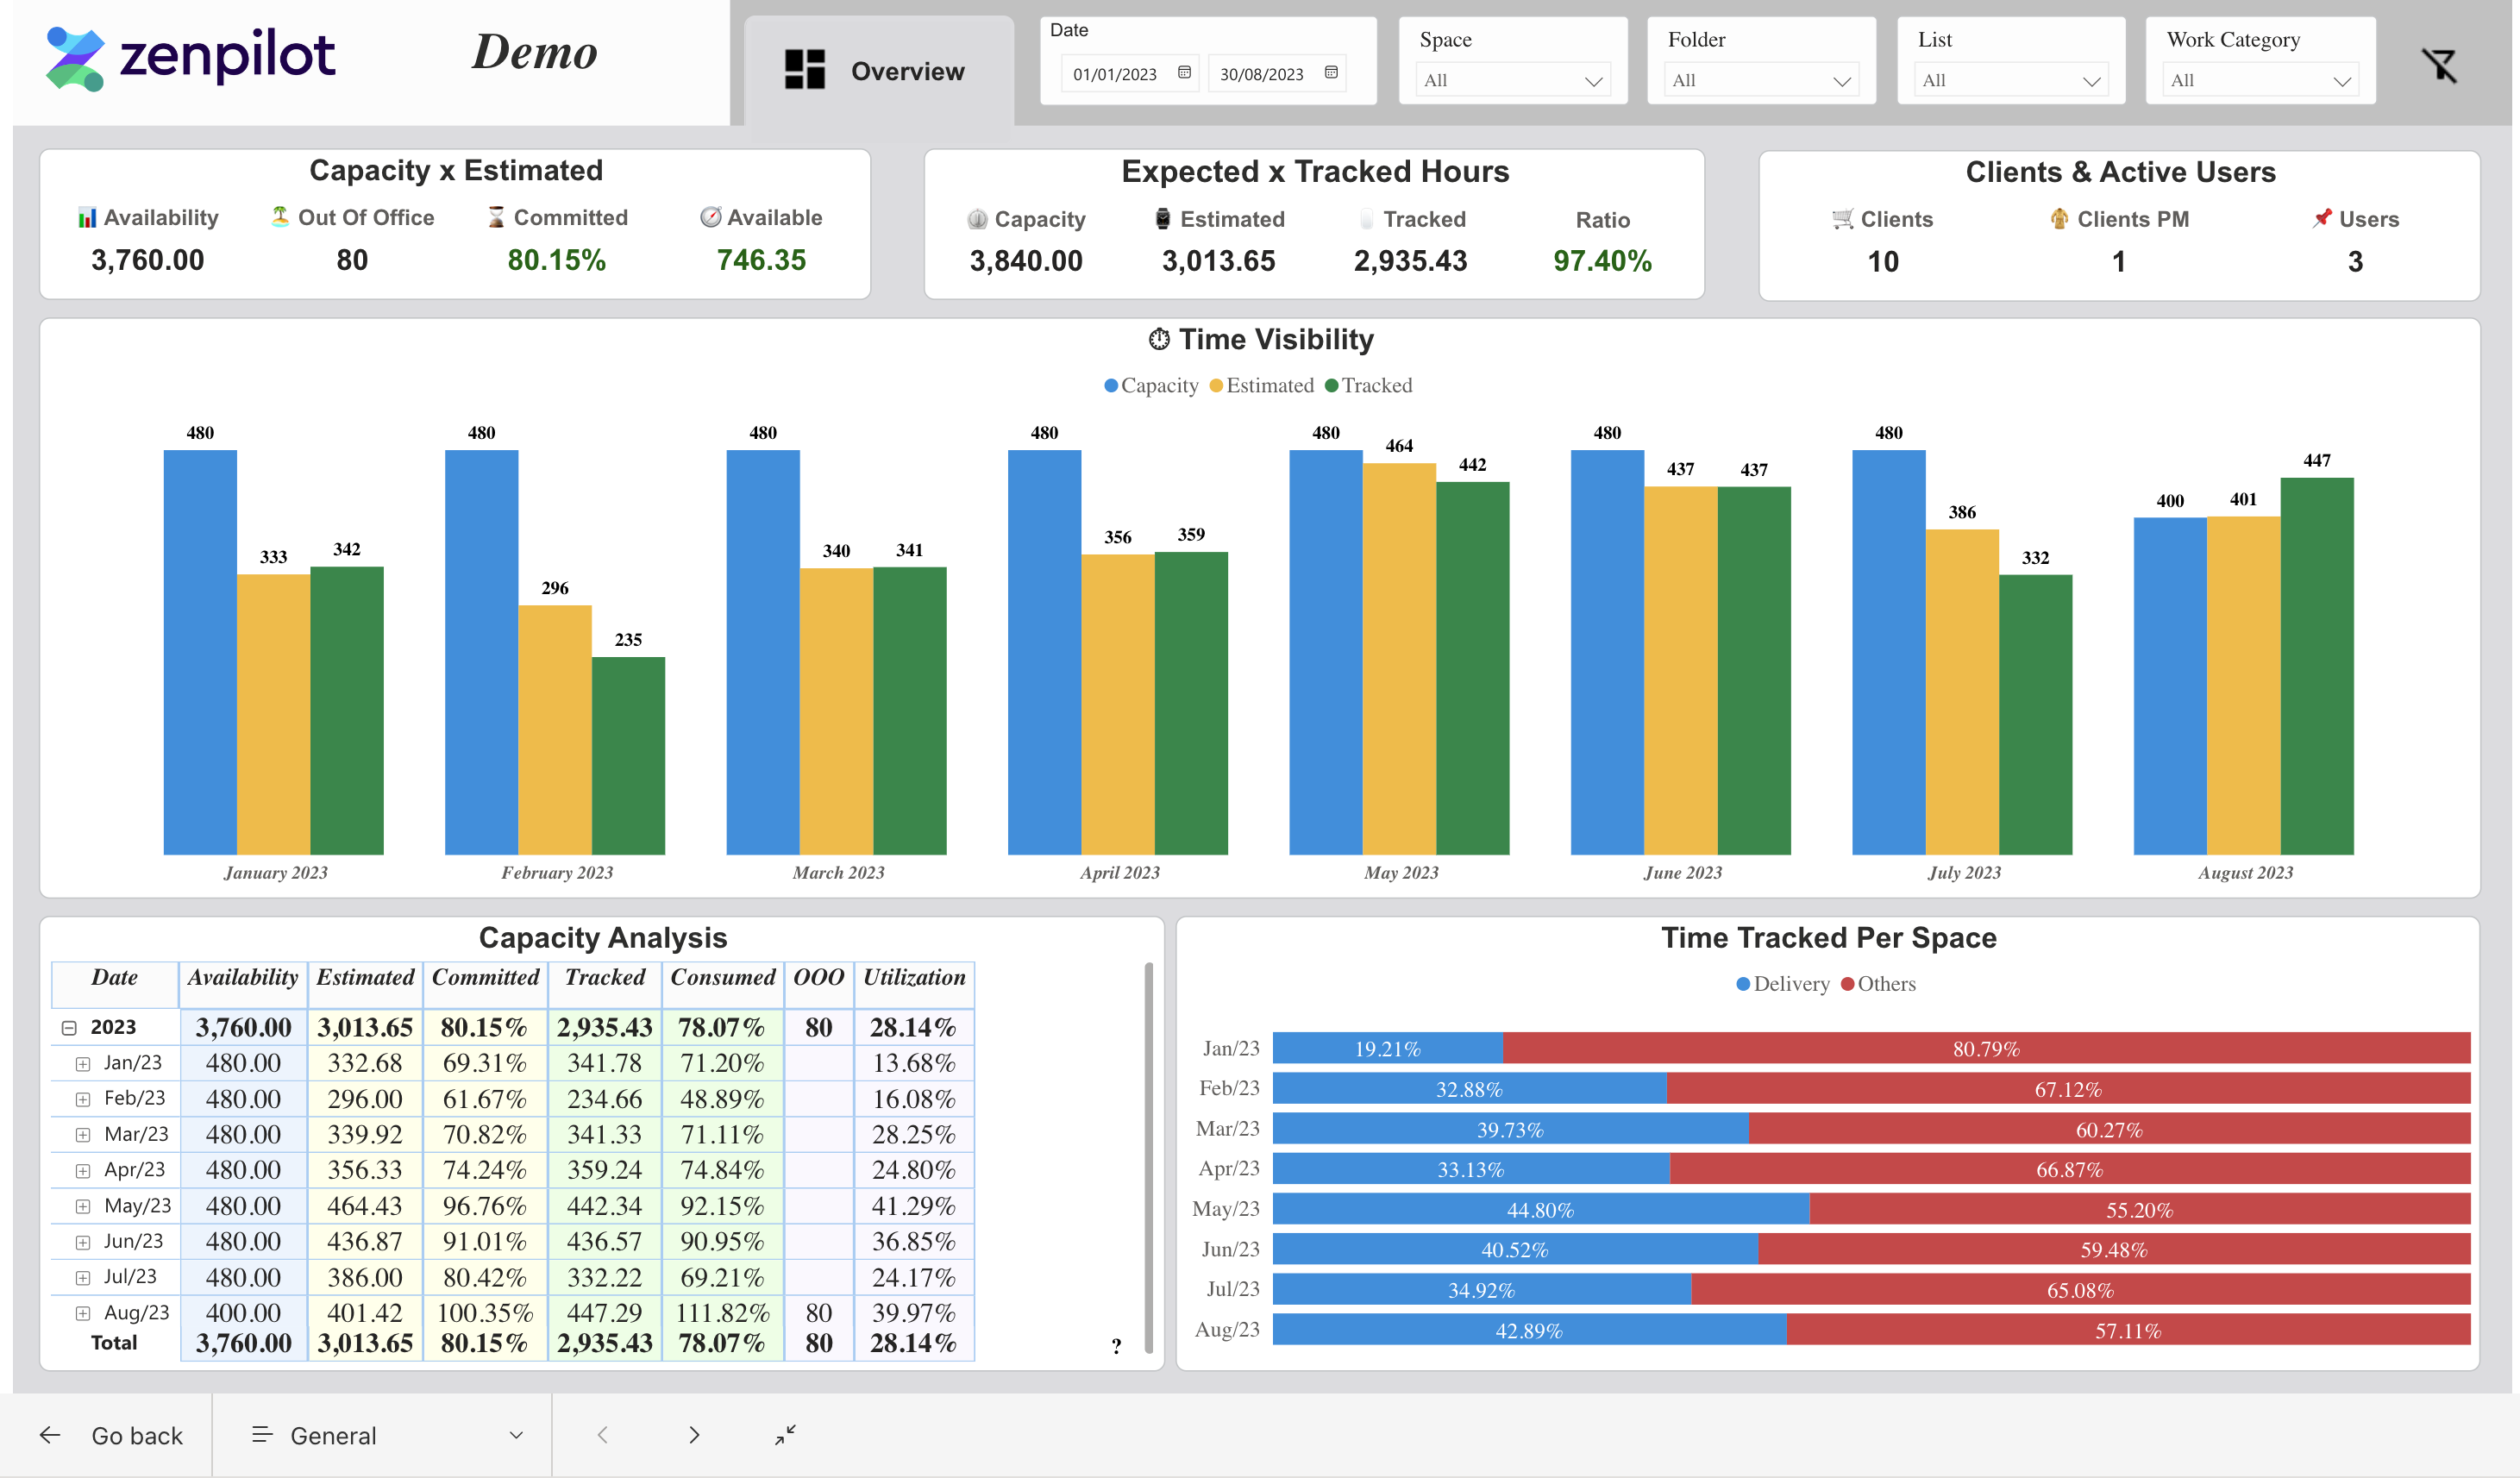
Overview – Check Capacity and Utilization at a Glance
The Overview dashboard provides agency owners with a high-level snapshot of their team's capacity, availability and utilization.
This view gives you quick access to:
- Total availability vs capacity vs time tracked
- Out-of-office hours
- Percentage of capacity that's committed to planned work
- Utilization - time spent on billable work
As Andrew explained:
"The overview provides high level visibility into how your team is running right now. Are we over or under capacity? How's utilization? It's your jumping off point to investigate issues."
As Andrew demonstrated, this consolidated view enables you to quickly spot resourcing gaps, identify unused capacity, and investigate issues with planning and allocation.
Having total availability, out-of-office time, and committed capacity in one glance gives you insight into your team's overall ability to take on work.
You can see right away whether you have the room to accept new clients or take on additional projects.
Regularly monitoring these metrics allows for more strategic decision making around resources and growth opportunities.
As Andrew advised, this bird's-eye perspective should flag any problems with workload balance or capacity planning.
For example, if your total availability far exceeds your committed capacity month after month, you likely have room to leverage your team more profitably.
On the other hand, if your capacity and time tracked regularly exceed availability, it signals an overworked team at risk of burnout.
All of this becomes possibly to quickly identify and address with this view.
Making utilization visible also provides an important profitability check.
You can set targets for billable time spent on client work versus internal efforts.
By dividing utilization into growth, delivery, and operations, you can identify imbalances and optimize staff time for maximum (sustainable) revenue generation.
In Andrew's view, the Overview gives owners a launching point to investigate issues and make impactful resourcing decisions. Monitoring these metrics helps you run your agency proactively rather than reactively month to month.
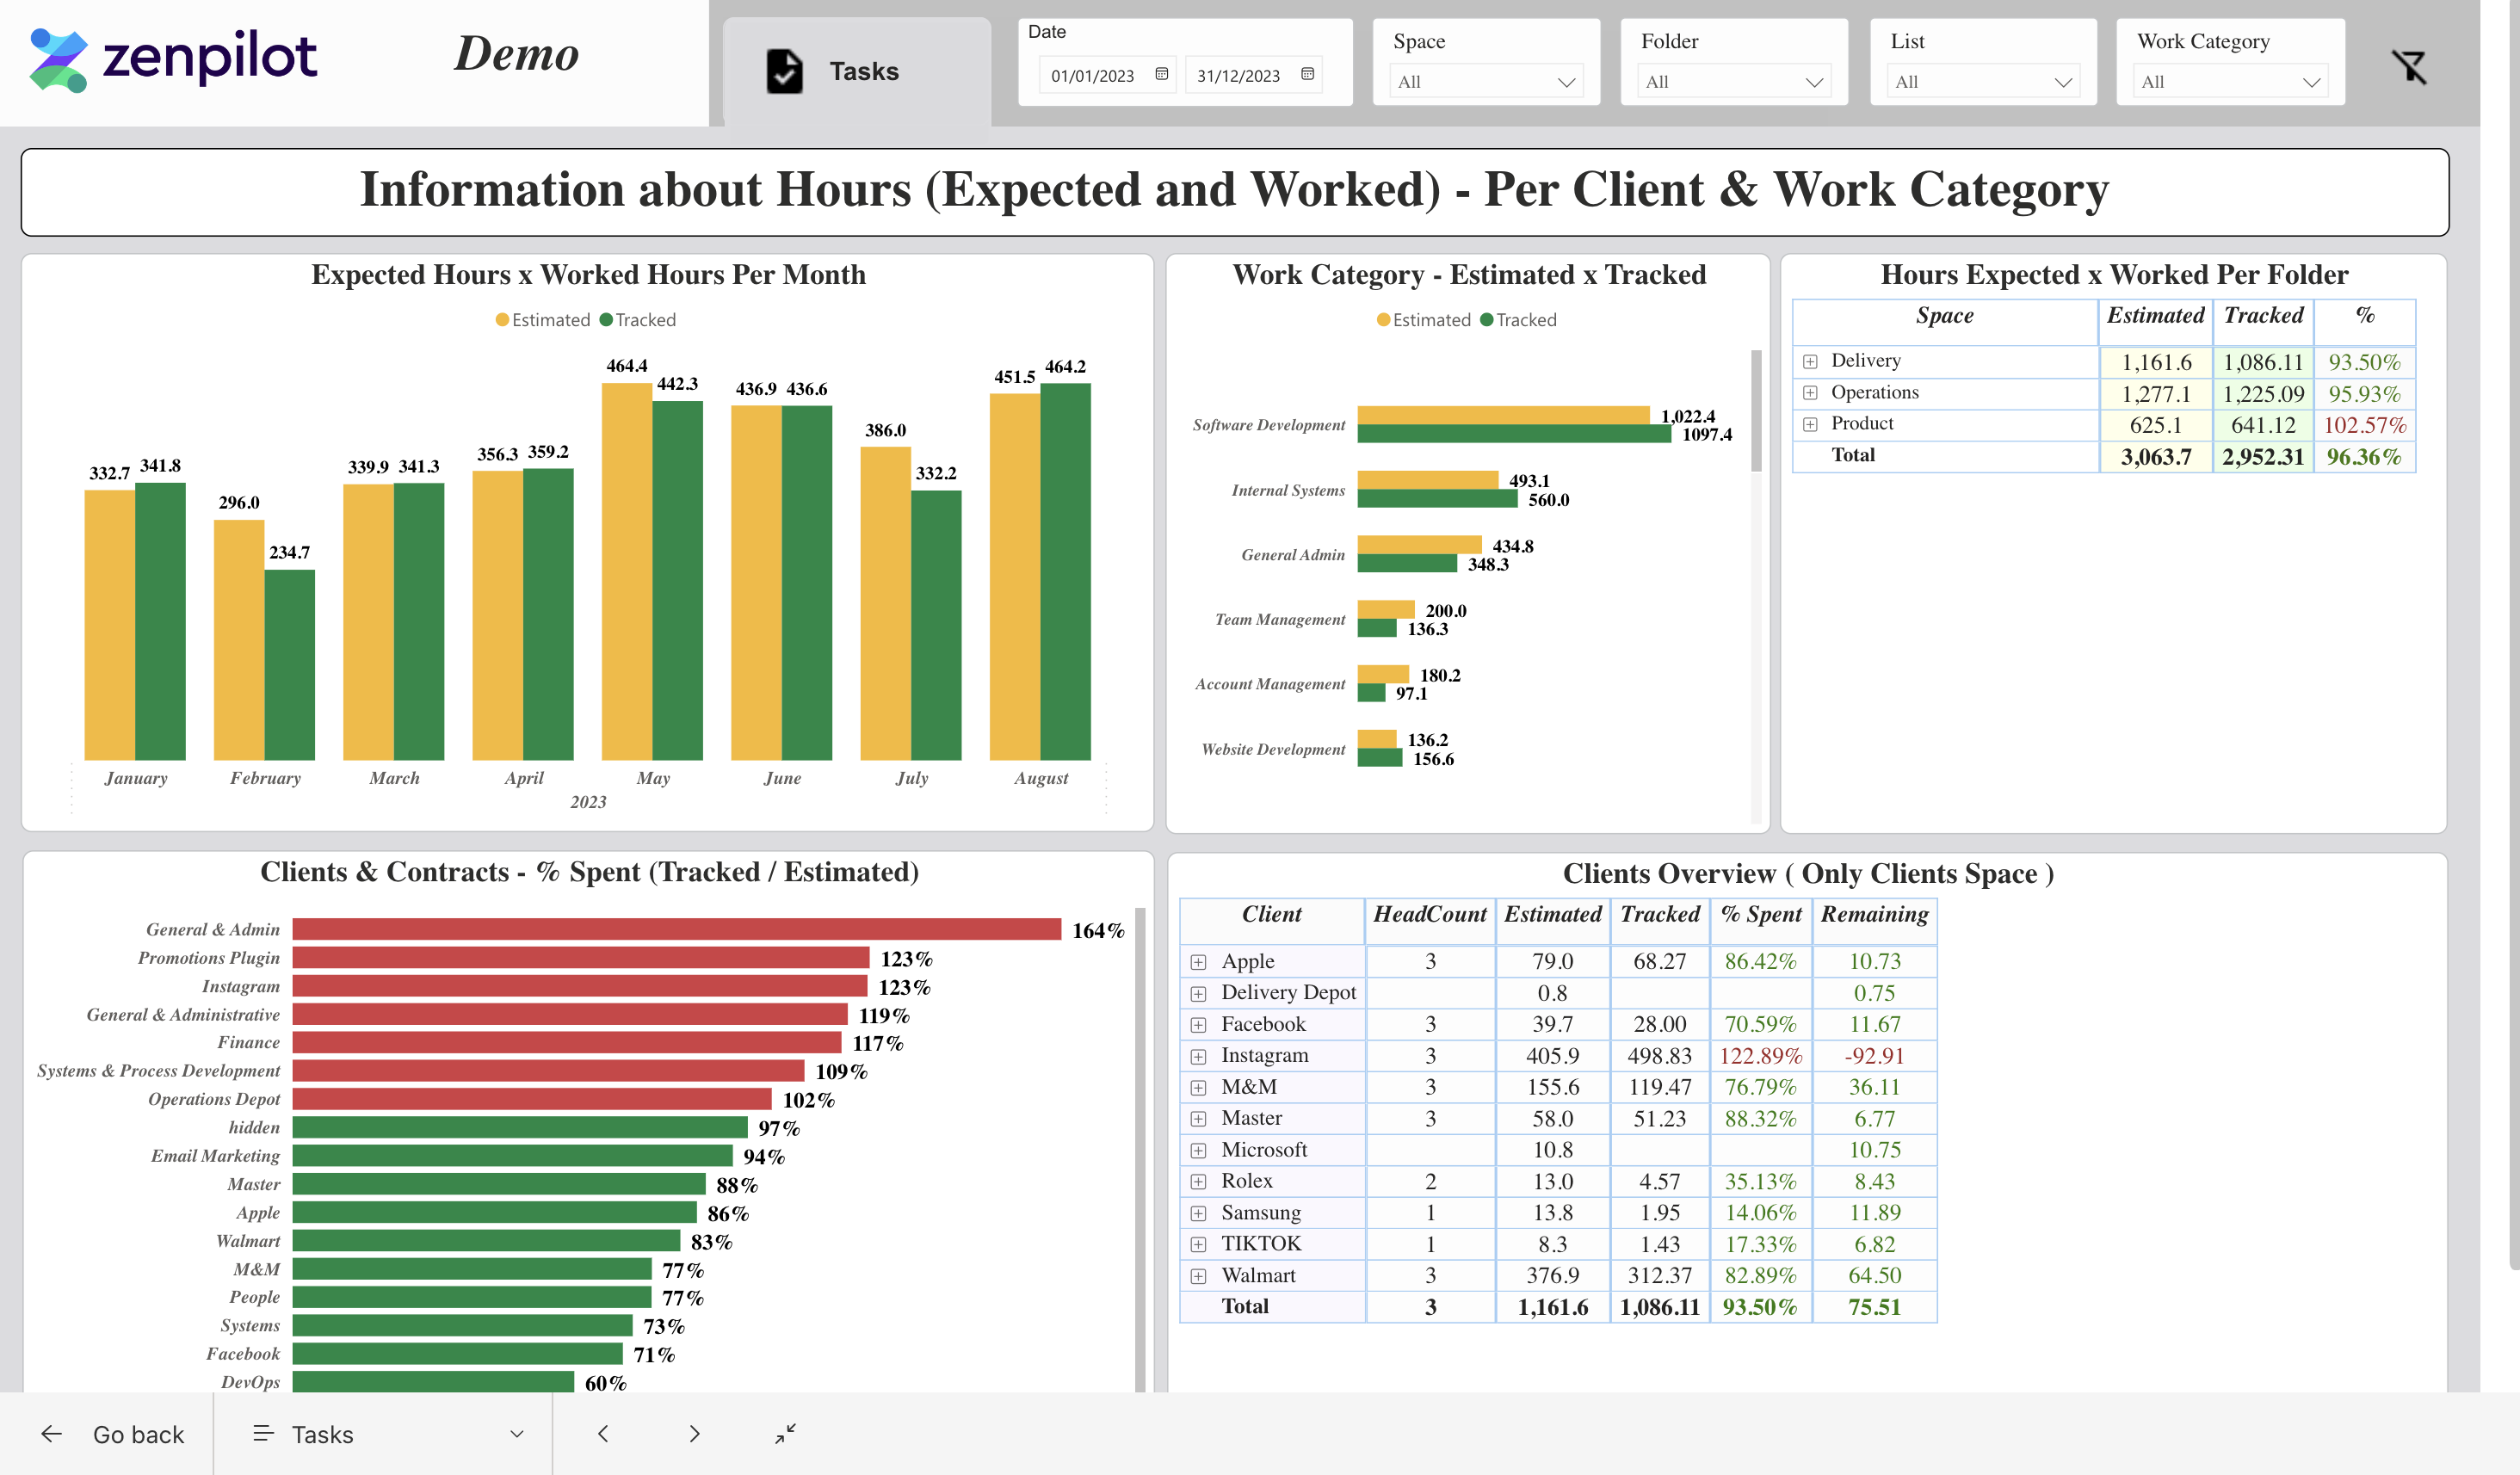
Tasks View – See Where You're Over- and Underdelivering
The Tasks view provides a more granular look at how your team is delivering against client requests and internal projects.
With this view you can analyze:
- Estimated vs actual hours month over month
- Time by work category or service line
- Trends and inconsistencies pointing to process problems
As Andrew showcased, you can analyze estimated versus actual time across your ClickUp tasks month over month.
In Andrew's words:
"This helps reveal which service lines are taking more time than estimated. Is one work category way off budget every month? Now you can dig in and find out why."
This comparison reveals inconsistencies and process inefficiencies limiting your profit margins.
With a standardized task template tied to each service offering, you can accurately predict and measure effort for different types of work.
When actuals vary widely from estimates, it signals a workflow issue to diagnose.
Andrew emphasized that dialing in accurate estimates relies on repeatable processes. Once you have a templated workflow for frequently requested services, you can refine based on data.
Tasks taking much longer than planned indicate the need to streamline or adjust capacities for certain work categories.
Segmenting time by service line or work category enables you to zero in on problem areas and optimize your delivery processes category by category.
As Andrew suggested, if one work type shows drastically overrun budgets, you can dig into the details and uncover why.
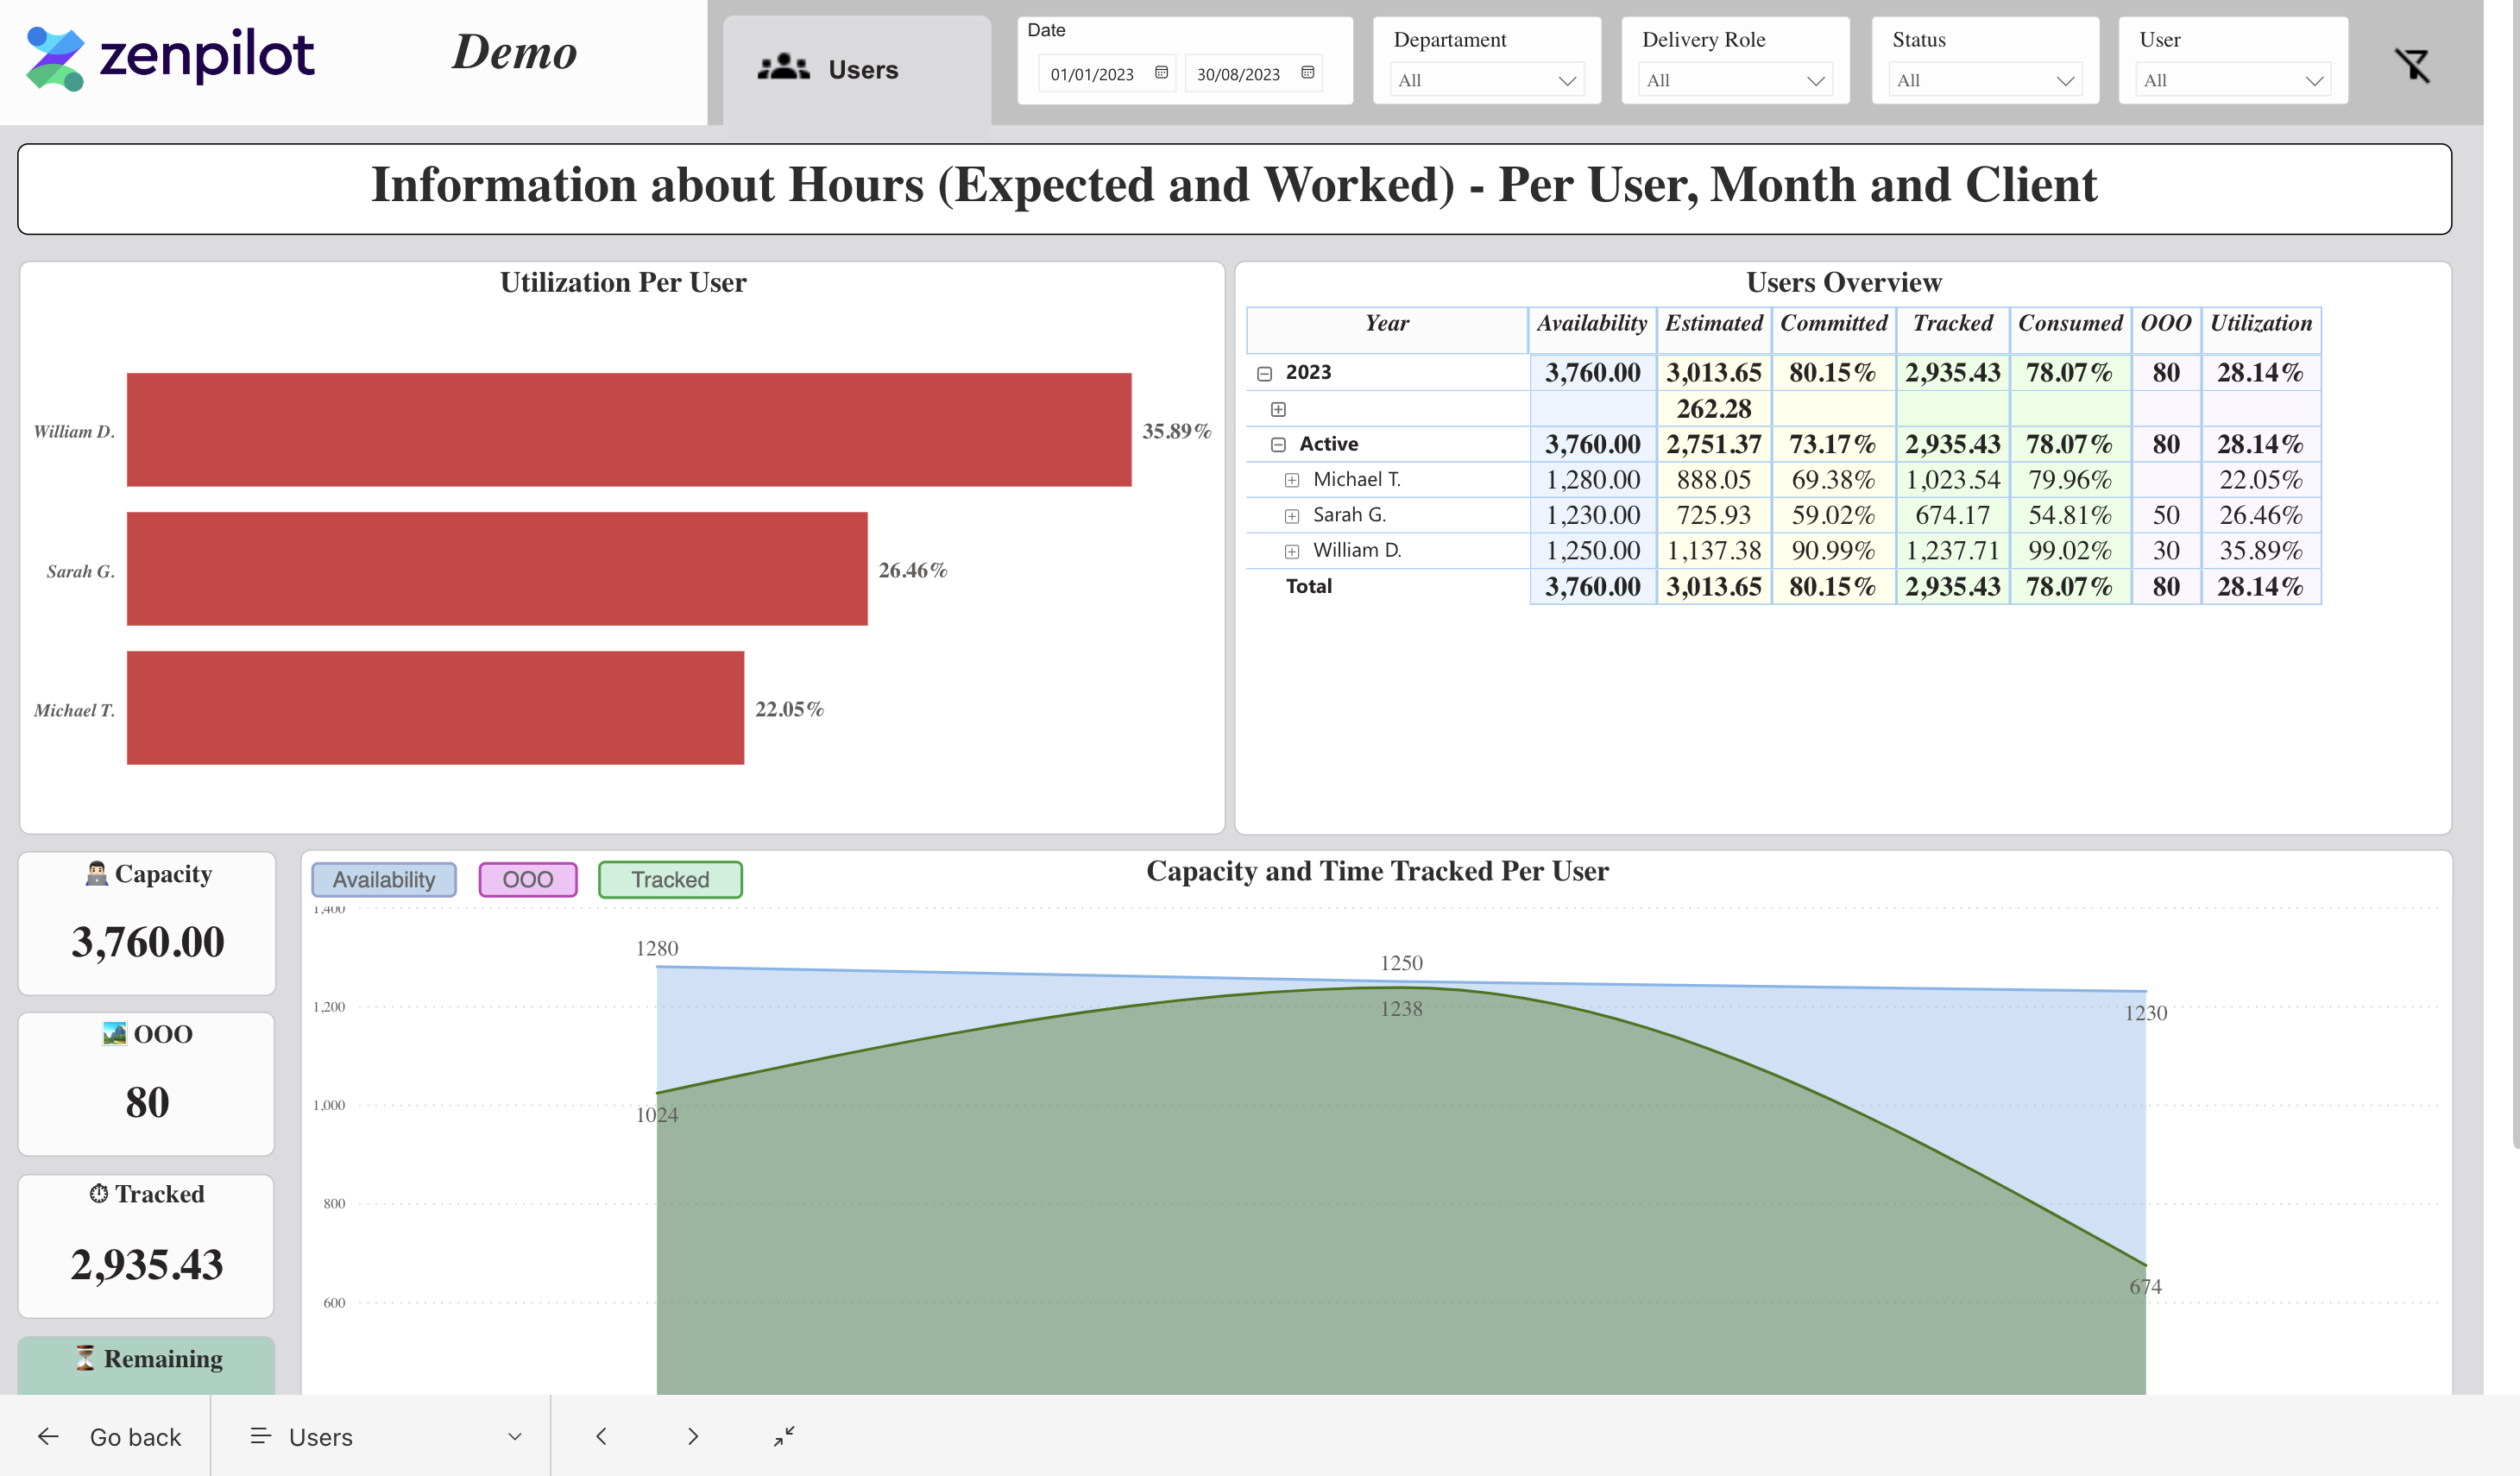
Users View – Check Time Tracking Quality and Check in With Struggling Team Members
The Users view provides visibility into the effort and capacity of individual team members.
Here you get metrics like:
- Utilization by team member
- Individual availability vs time tracked
- Capacity breakdown across the organization
As Andrew outlined, these metrics allow you to set and manage utilization targets based on roles. For client services resources, you likely aim for higher utilization, while internally focused staff may have lower targets.
Having availability versus time tracked data for every user gives you insight into their capacity and fit. This quickly surfaces any resourcing gaps, such as a high availability employee with low utilization. You can then reassign work to maximize their time.
As Andrew emphasized:
"This view enables you to catch utilization issues early before they become major problems. You can also identify resourcing gaps and opportunities."
On the other hand, when tracked time vastly exceeds availability for a team member, you're looking at someone who's overwhelmed and at risk of burnout. You can redistribute responsibilities or shift internal work to restore balance.
Andrew noted that this view empowers leaders to catch underutilization early before it drains profitability.
But the key to making it work is having team members track time as they complete each task, so activity directly ties back to planned work in ClickUp.
When you have such granular insights, you may even be able to spot team members who are struggling with their work—or “quiet quitting”.
With visibility into capacity across the organization, you can better plan for fluctuating demands and reassign staff to avoid duplication.
Monitoring this data will allow you to optimize resources and headcount as your agency scales.
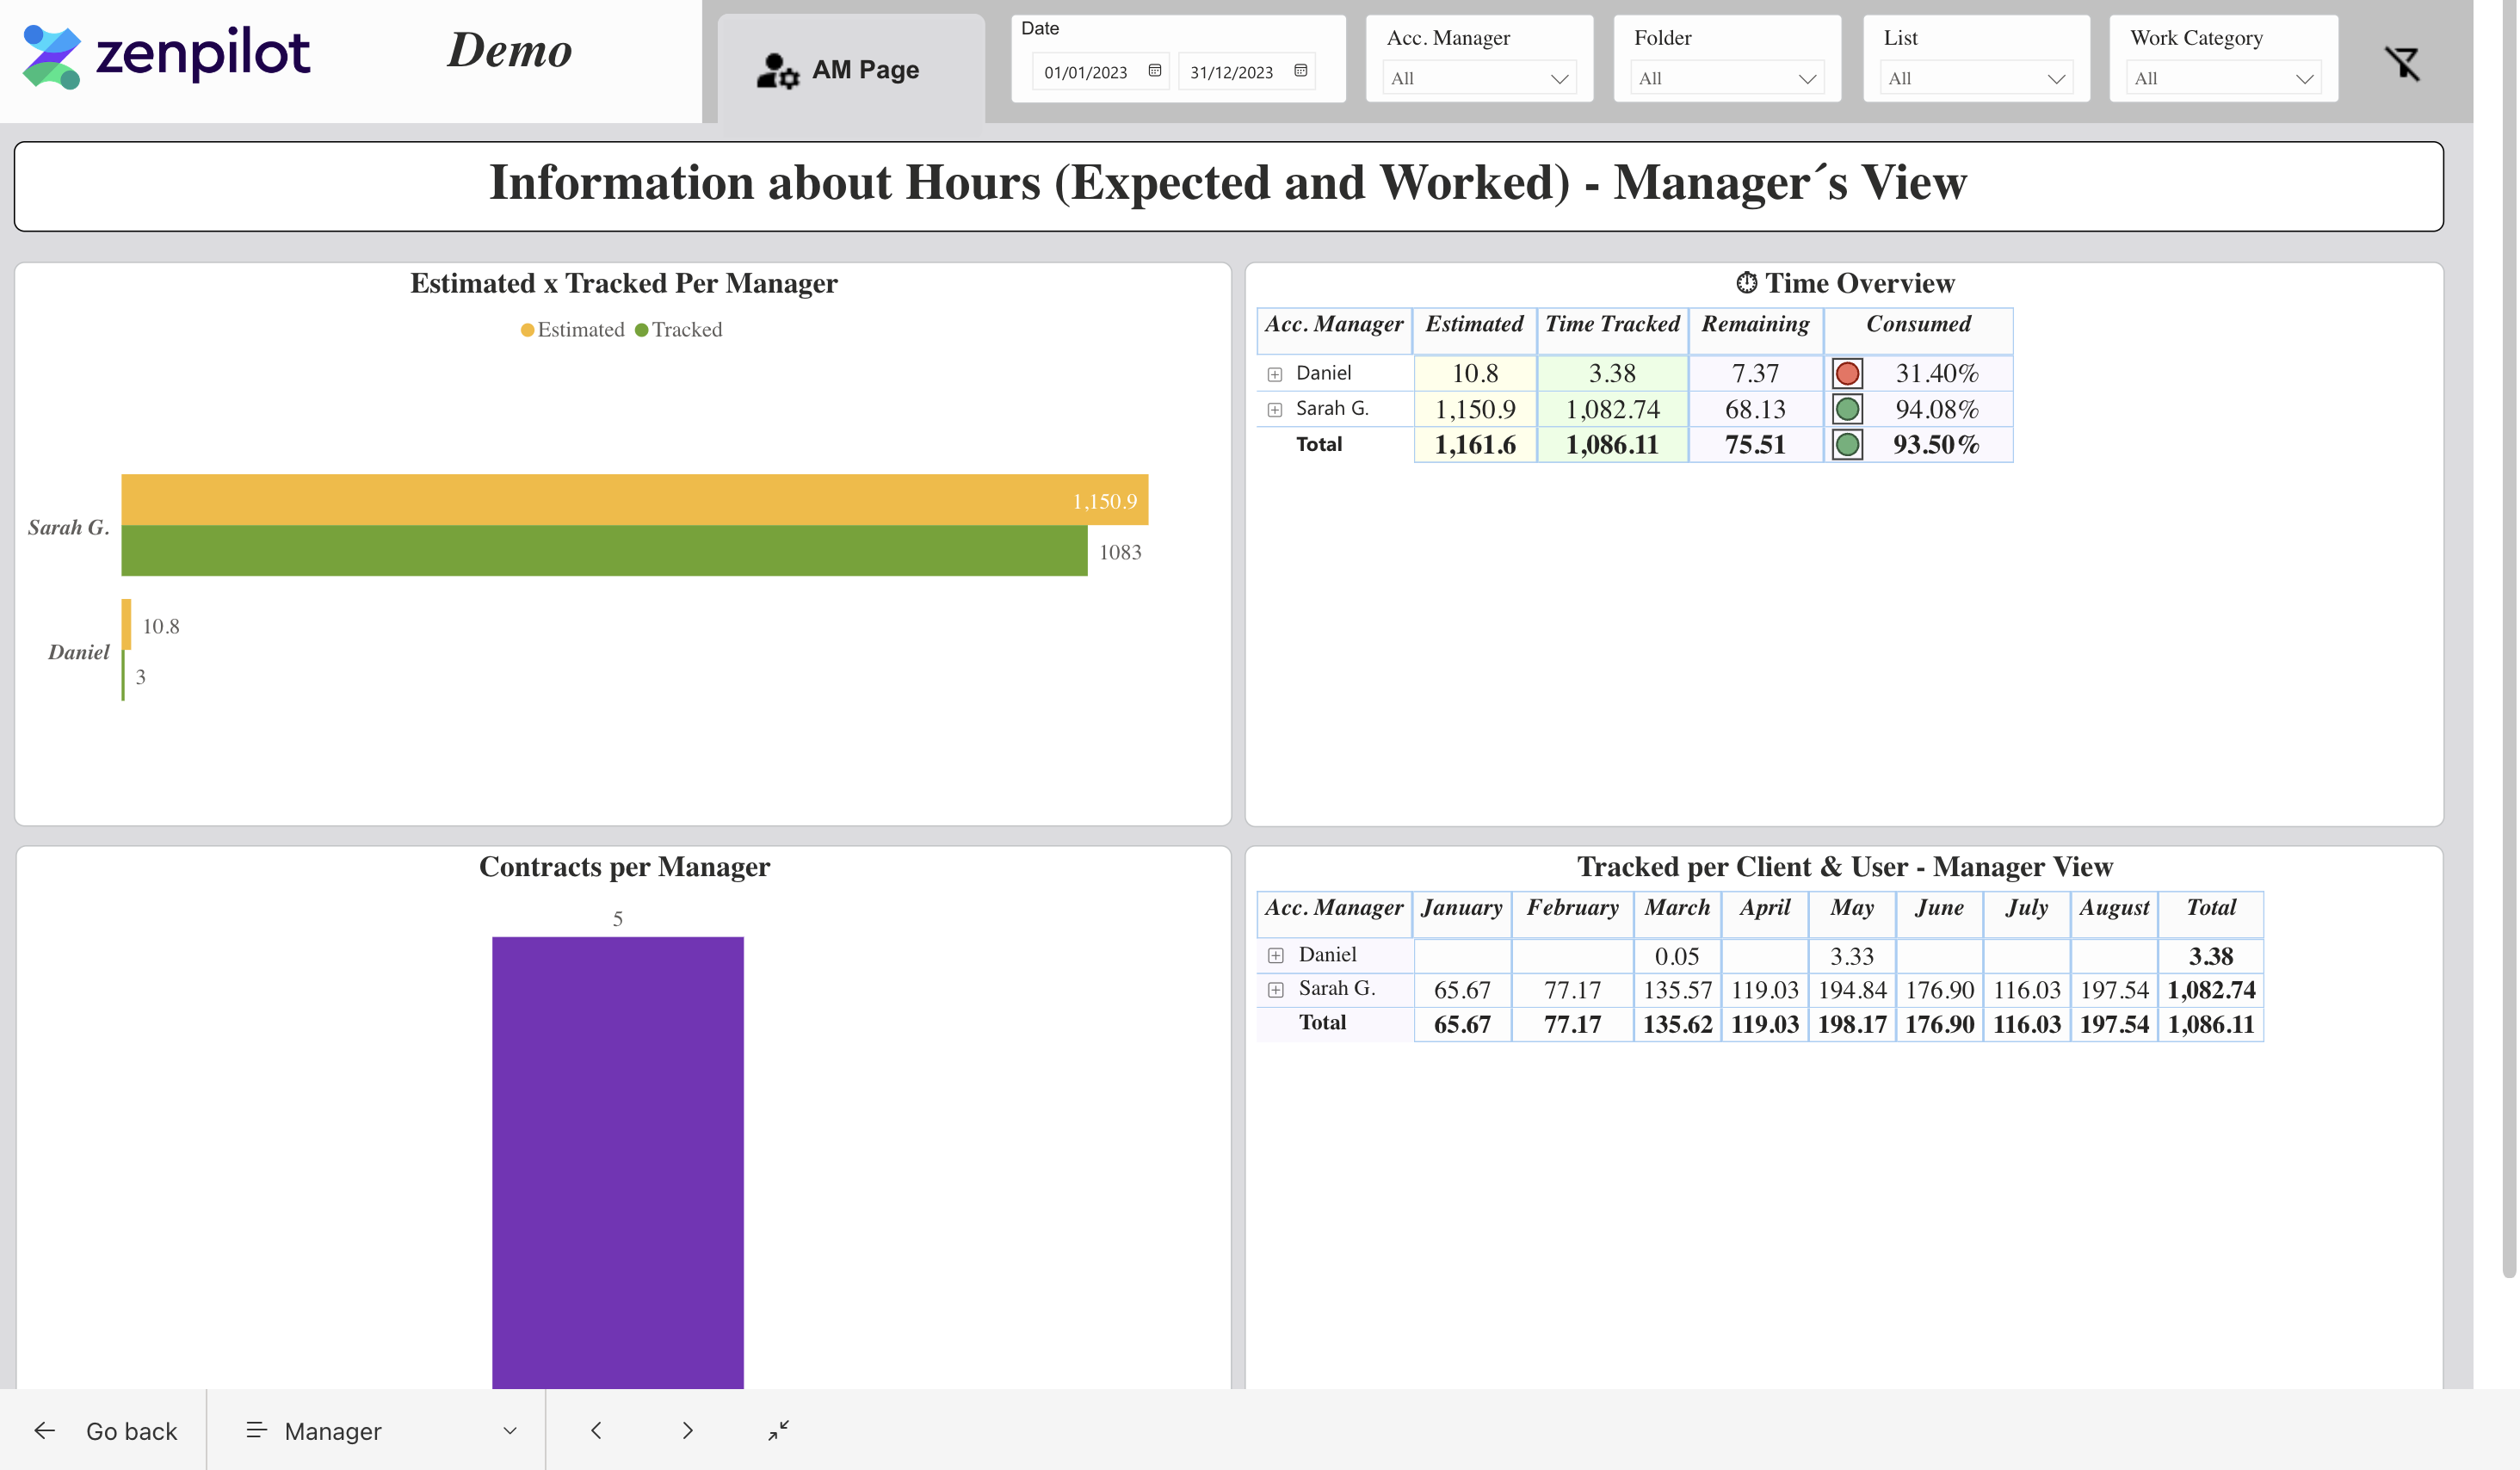
Account Managers View – Get Your AMs Laser-Focused on Profits
For agencies with dedicated account or client management roles, the AM view provides critical insight into their budget oversight and profit delivery.
As Andrew explained, this reporting ties together the account manager, clients, contracts ,and estimated versus actual time for complete visibility.
Some key account manager data:
- Estimated vs actual time across clients
- Budget remaining based on contracts
- Number of active contracts per AM
Andrew on the value:
"As an agency owner, you can easily assess how well your account managers are delivering within budget and meeting client expectations."
Having time forecasts and actuals roll up by AM allows owners to assess workload balance across client teams.
You can quickly identify any account managers at risk of overrunning budgets across their book of business.
This enables course correction before major profitability issues arise.
In Andrew’s view, these metrics provide accountability for account managers to deliver profitable engagements within defined budgets. Tracking estimated versus actual time by client against each contract highlights any problem areas needing attention.
Additionally, the number of active contracts per AM indicates capacity to take on more clients.
Combined with the budget metrics, you can ensure account managers have balanced portfolios and maximize profitability.
This data empowers fact-based conversations around profit expectations and capacity planning with your account management team. You have clear visibility to reset priorities and adjust workloads when needed.
Costs View – Find The Hidden Profitability Drains
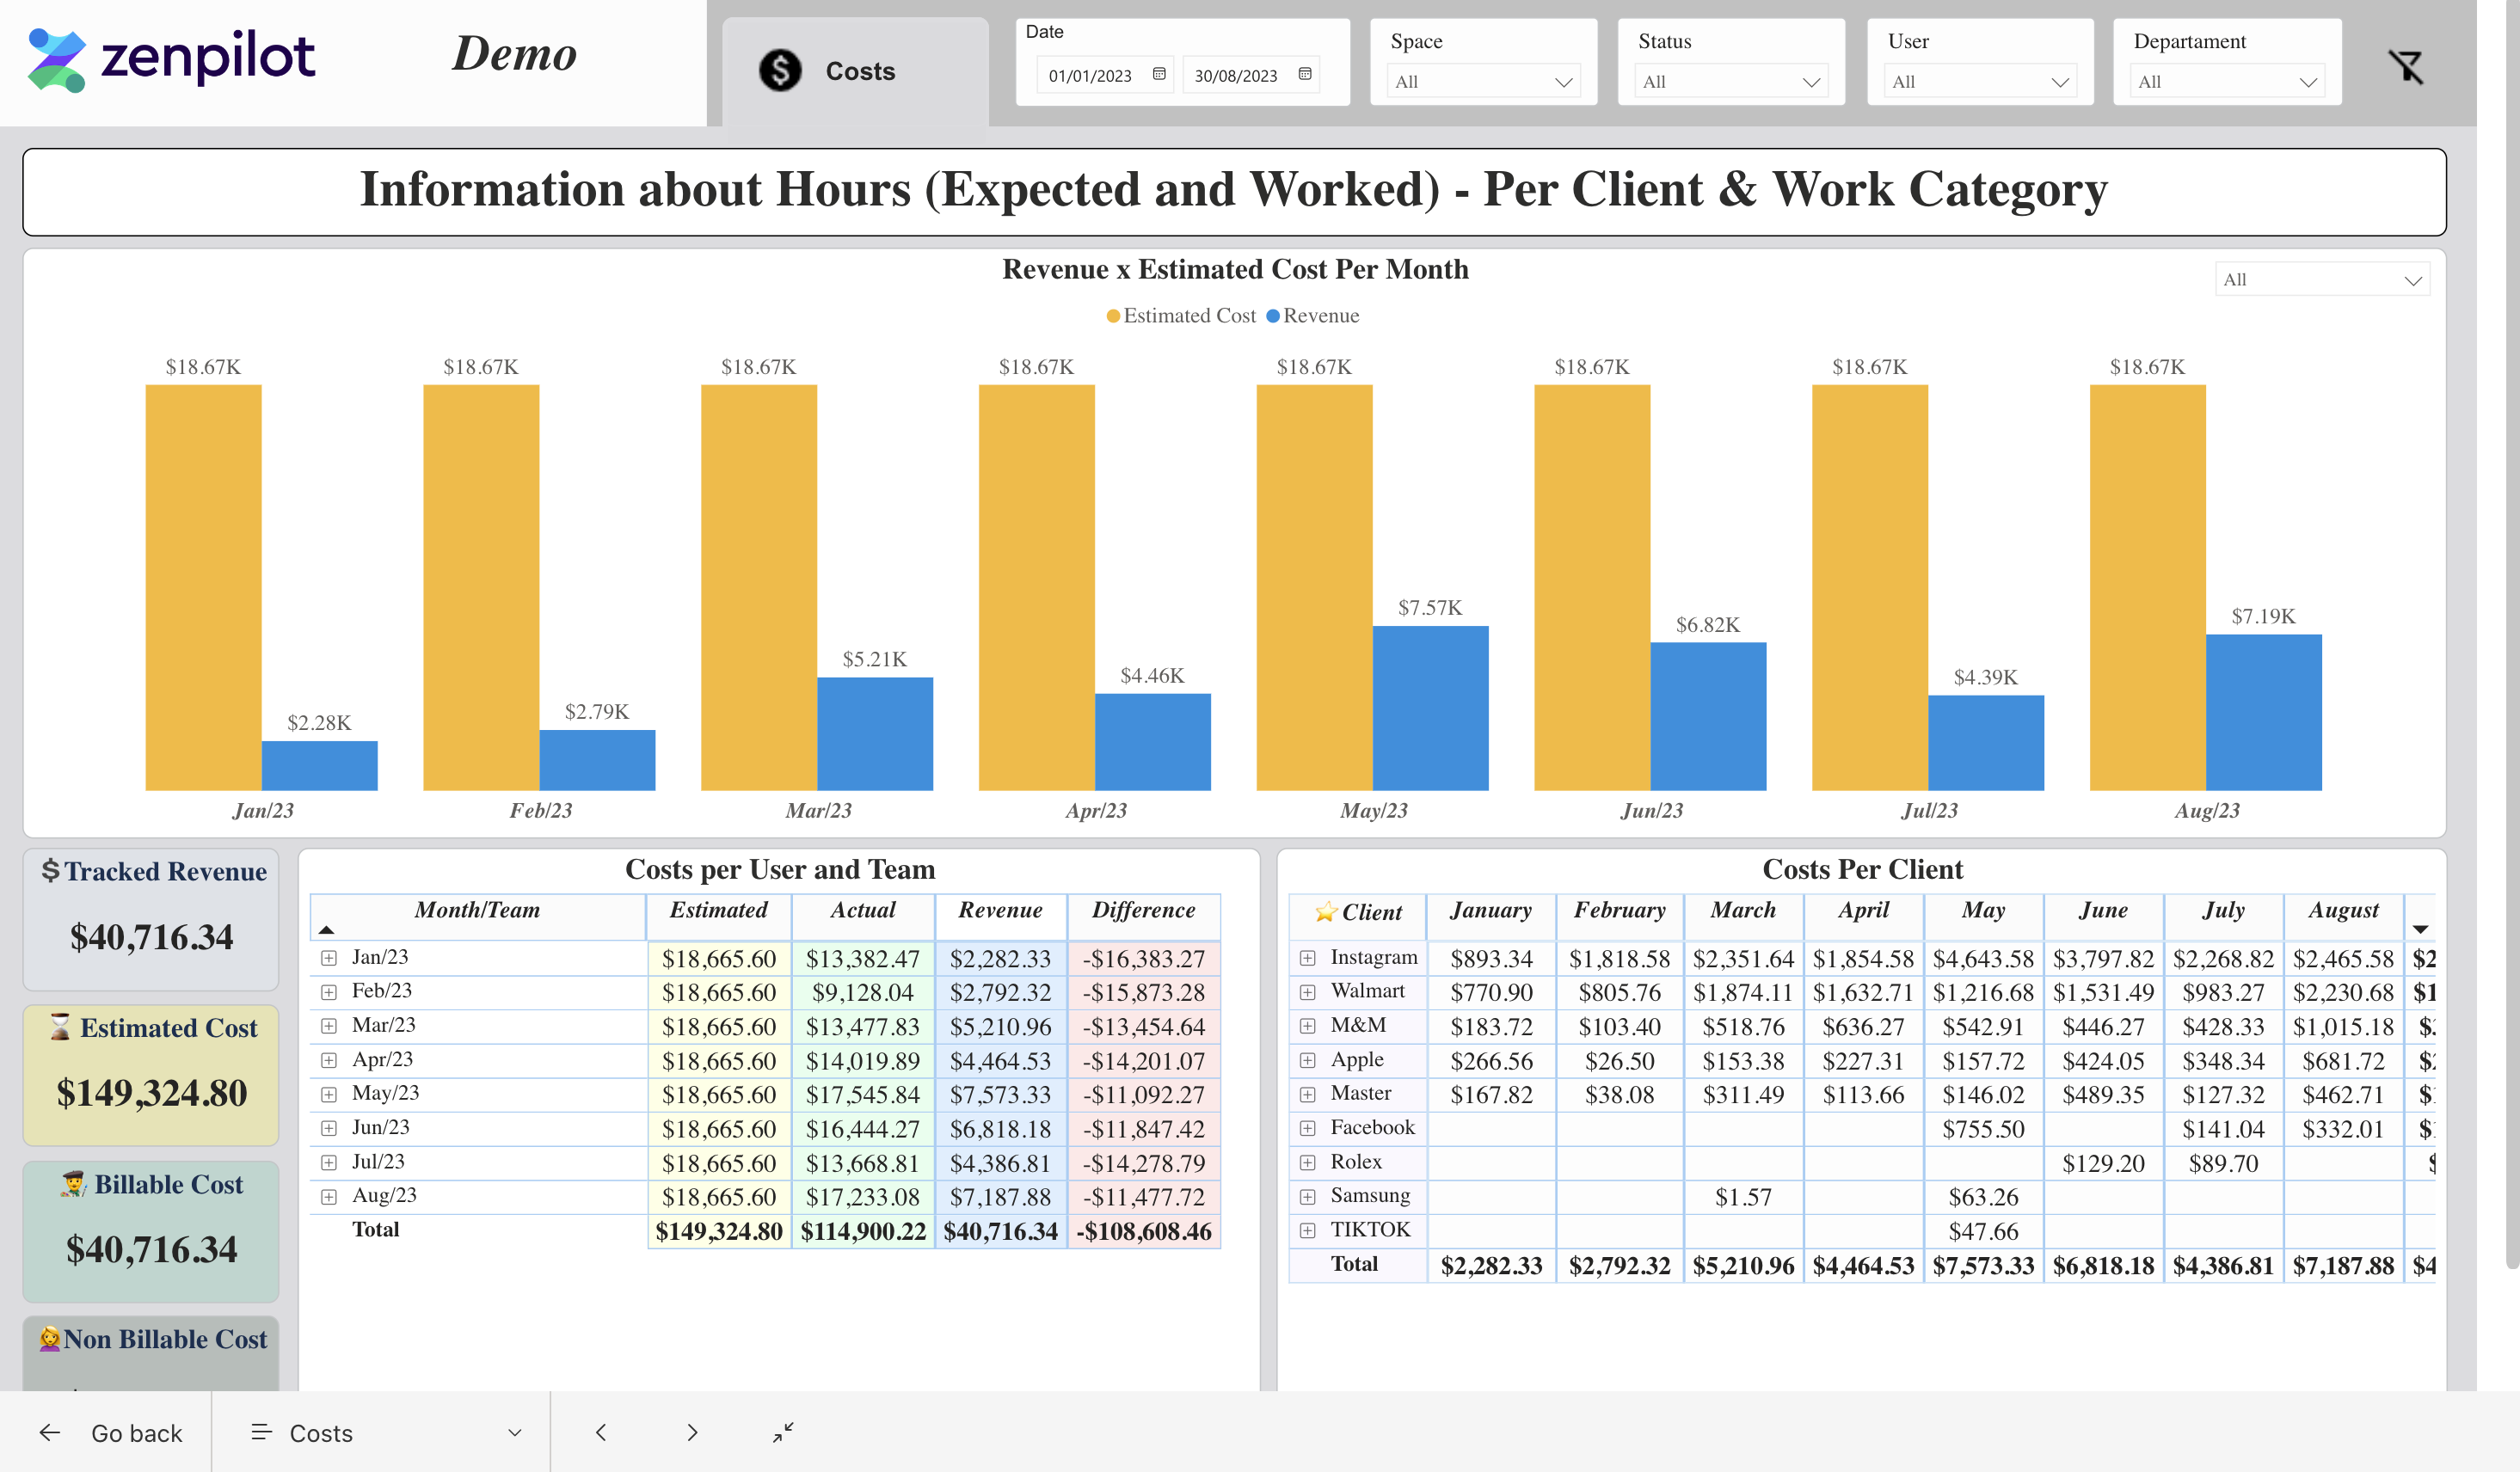
To understand true profitability, you need visibility into your costs associated with client work. As Andrew outlined, ZenPilot Reports connect your labor expenses to time tracked in ClickUp for actionable insights.
For costs, you can analyze:
- Cost of labor across clients
- Drilldown into cost by service line
- Comparison of estimated vs actual spend
In Andrew's view:
"By tying costs to time tracked, you can see exactly where your budget is going each month. When a cost is exceeded, you can investigate the breakdown."
You can analyze overall costs across clients as well as drill down into cost by service line. This reveals where budgets may be getting off track at a more granular level.
By tying expenses directly to work performed, you can identify specific workflows to optimize.
Andrew noted that comparing estimated costs versus actuals relies on accurate and up-to-date user rates in ClickUp. This enables you to calculate true fully loaded costs per team member. Without precise planning rates, your profitability picture will be skewed.
Once you have costs integrated with tasks and workflows, you have tremendous flexibility to segment data. Filtering down to a single client or service line helps you pinpoint lucrative engagements versus problem accounts.
In Andrew’s view, connecting costs to time entries provides essential profitability visibility–from a macro agency view down to micro client or project details. All of which supports your decision making.
Budgets View – Analyze Profits Per Client And Service Line
For agency owners, one of the most critical reporting needs is understanding profit margins across your client engagements.
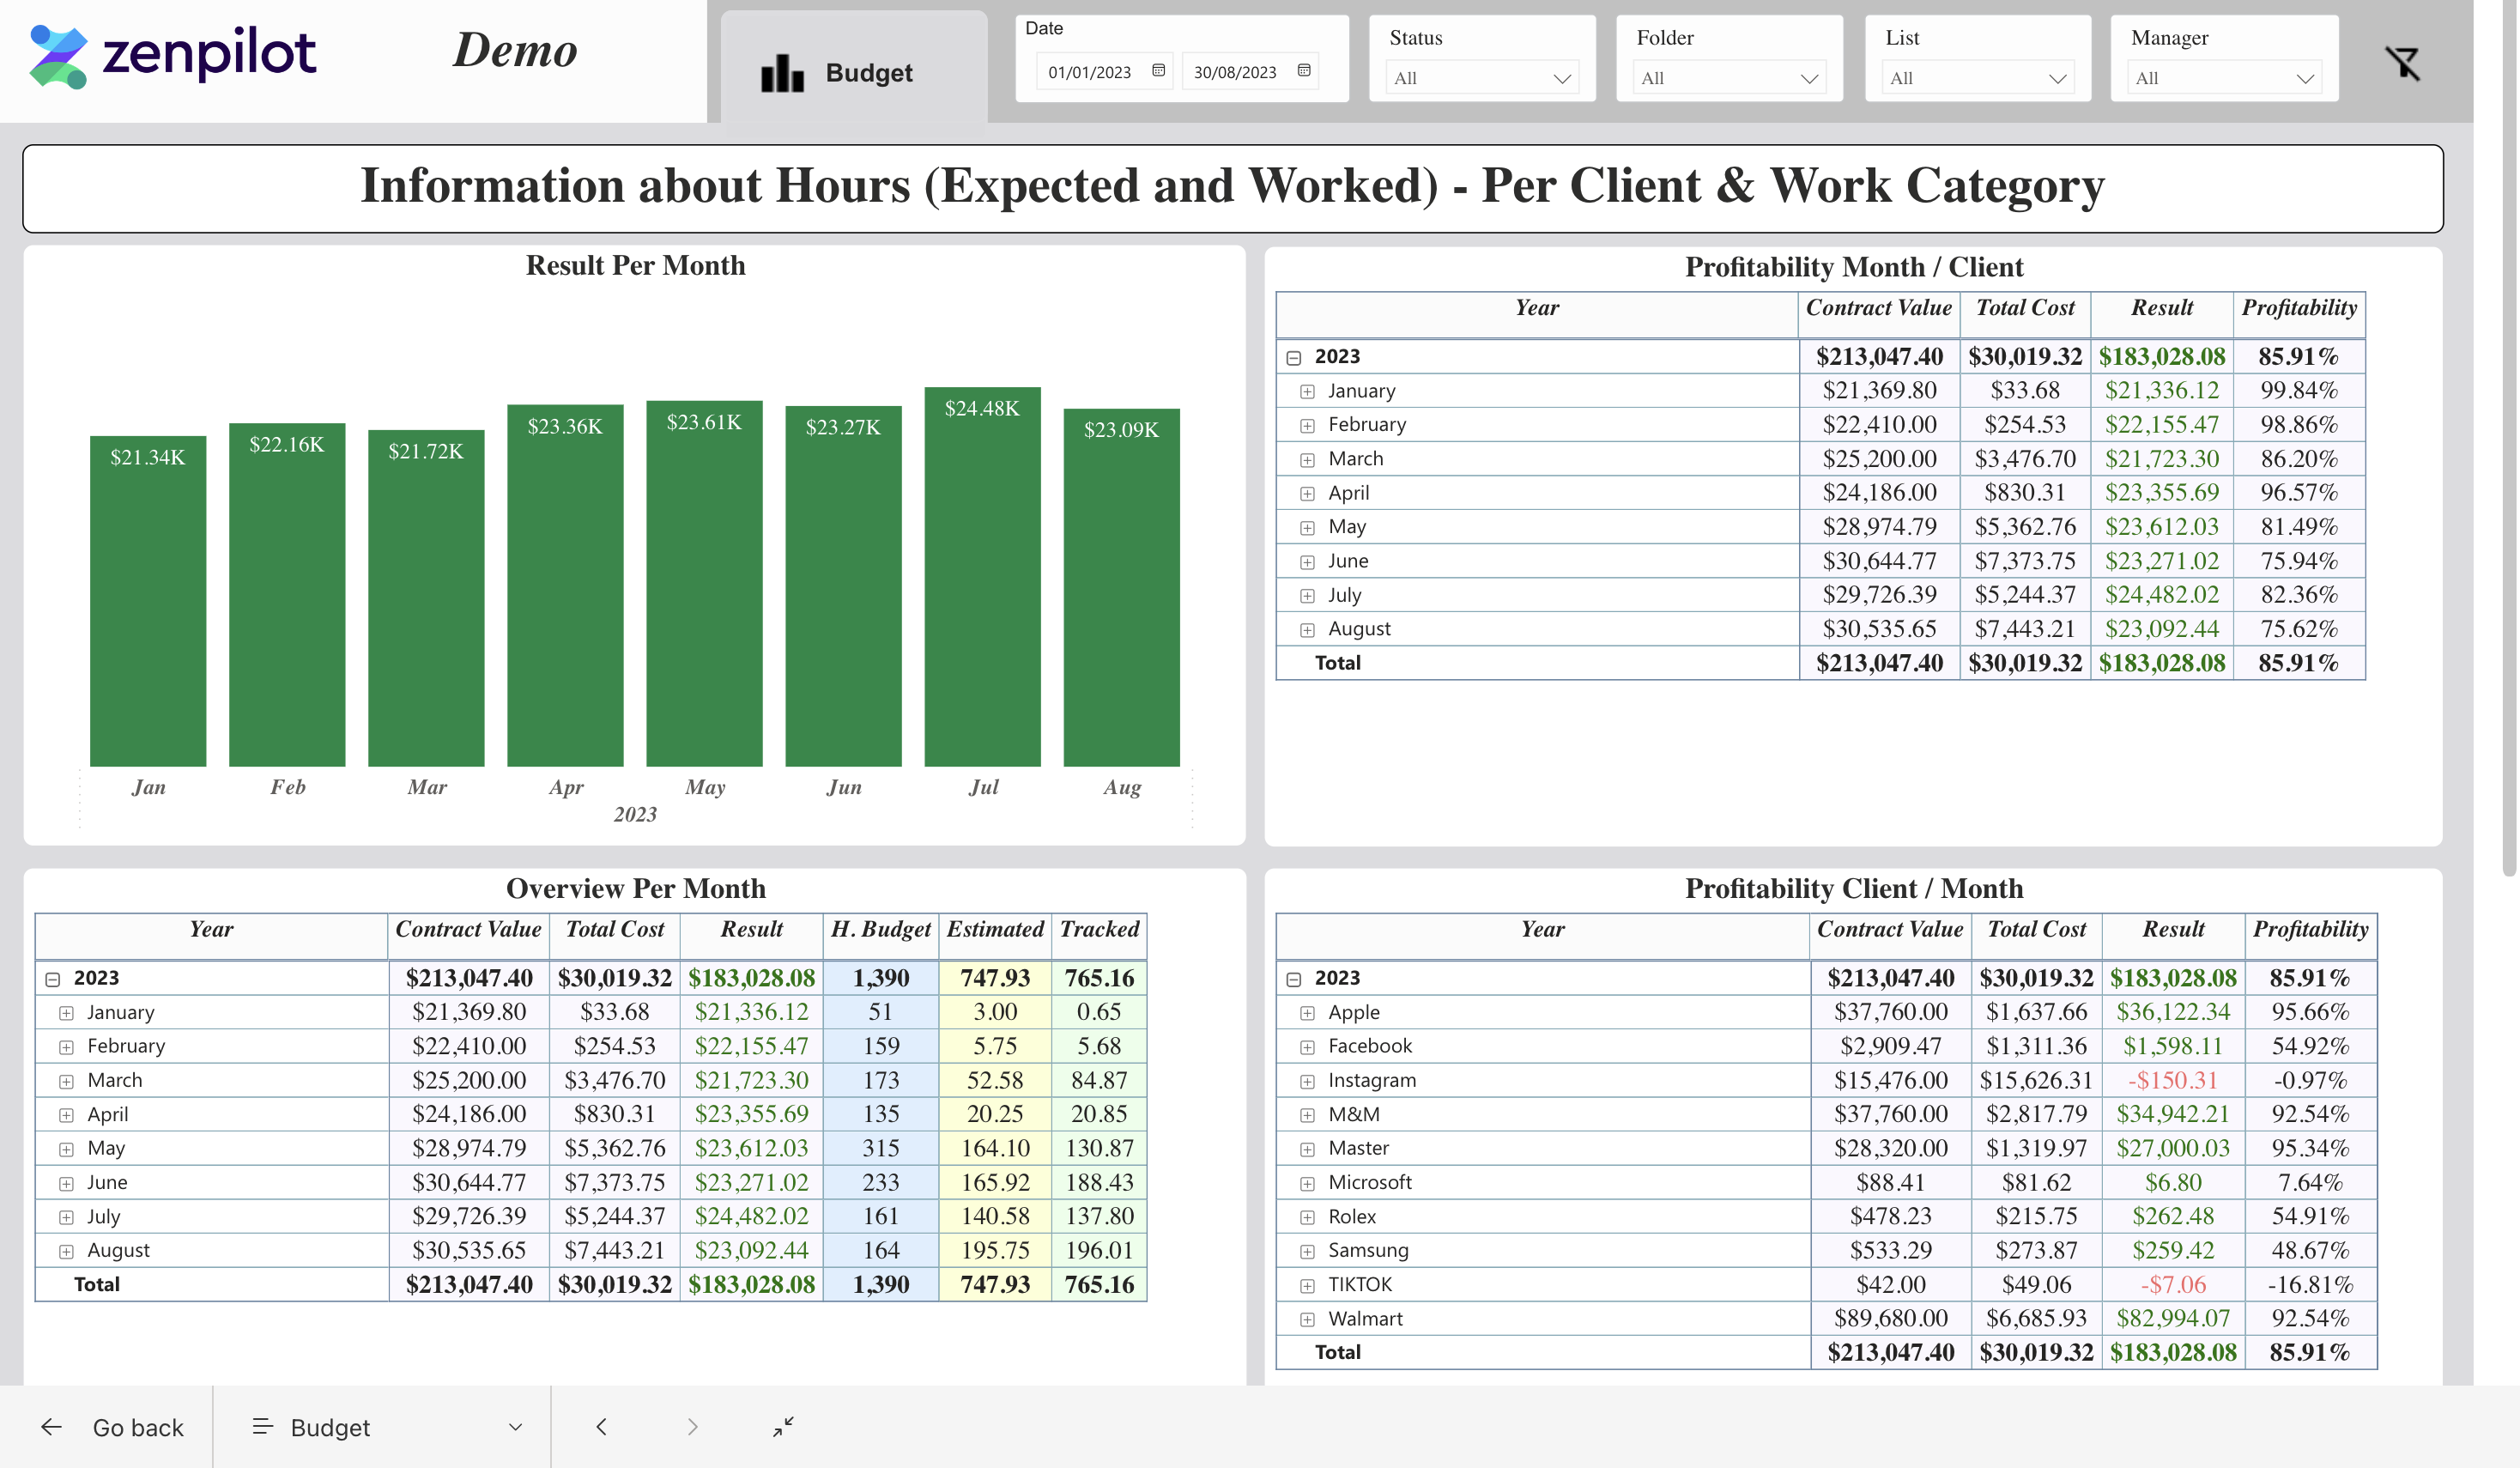
As Andrew highlighted, the Budget view clearly surfaces both macro and micro profitability trends.
Finally, for overall profitability you see:
- Time tracked vs budgeted
- Revenue vs costs
- Profit margin overview and detail
As Andrew explained:
"This shows clear profitability by client, so you can quickly identify winners and losers. If there's a red flag, you can course correct fast."
At a high level, you can instantly spot red and green indicators showing contracts exceeding or missing profit targets. Drilling down into the details allows you to diagnose the root cause and take corrective action faster.
Having time tracked vs budgeted immediately exposes unprofitable accounts burning unnecessary resources.
You can also filter by account manager to assess their individual book performance.
By combining budgeted costs with actuals in one place, you don't need to combine data from various tools to answer the critical question: are we making money? ZP Reports simplifies profit visibility so you can easily scale what works and cut what's weighing you down.
Andrew especially emphasized the value of exposing profit issues early while they are still addressable. Rather than waiting for month-end reports, you have real-time insight to course correct unprofitable engagements.
This reporting empowers agency owners to make fact-based decisions on resourcing, staffing and client account management. Paired with solid processes and habits, this will allow you to put your agency among the best of the best.
What Does It Take to Enable Such Granular Reporting?
As Andrew emphasized multiple times during our live stream, actionable reporting relies on much more than just slick dashboards.
Without the proper underlying ClickUp structure, standardized processes, and engrained team habits, any reporting will be flawed. As Andrew put it:
"The key to clear reporting is standardized data structure. It doesn't matter what you're reporting on—if you lack tight definitions and habits around data entry, your reports will be meaningless."
He explained that the blank slate flexibility of ClickUp can be both a blessing and a curse. Without thoughtful structure, you miss out on the full benefits.
Andrew outlined several best practices that lay the foundation for accurate reporting:
- Centralize data in ClickUp - Avoid mismatches across tools by making ClickUp the single source of truth. As Andrew noted, overlay tools like Everhour that aren't baked into your workflows create inconsistencies.
- Standardize processes - Build repeatable playbooks for your services that facilitate predictability. This prevents every project from being treated as a unique, one-off effort.
- Set team habits - Require task-based time entry instead of monthly logs. As Andrew advised: "You want real-time time tracking tied to workflows—not people remembering and entering data after the fact."
- Permission and restrict access - Sensitive data like user rates can (and in many cases, should) be locked down and hidden from unapproved team members.
- Maintain accurate user rates - This is essential for calculating true fully-loaded costs and profitability. While ClickUp doesn't have native functionality for tracking rates, Custom Fields make it possible to build and keep that data centralized in ClickUp.
- Regularly update templates with real data - Using profitability and effort insights from your reporting, you can continually refine your templates as you uncover process improvements.
Andrew was adamant that creating the right structure, processes and habits comes before deploying reporting tools. As he put it:
"Reporting solutions like ZP Reports sit on top of those core elements. Without the solid foundation, the visibility will be flawed."
He urged agencies to focus first on strategy, structure and execution.
Only once those pieces are locked in will you have data you can trust in your reporting dashboards.
If the underlying data structure and habits aren't there, your reporting will be flawed no matter what system you use.
But once you implement the needed structure, the insights unlocked are game changing.
How Do You Get Started With Better Profitability Reporting?
If you're ready to take your reporting to the next level, Andrew and I suggest having a consultation call with ZenPilot to discuss your current setup.
You can visit www.zenpilot.com/call to get started.
Some key steps in our process:
- Audit your existing ClickUp setup and workflows
- Identify gaps preventing accurate reporting
- Create an action plan to address issues
- Implement needed structure and habits
- Integrate ZP Reports for unmatched visibility
- Ongoing optimization and refinement
For agencies already following ZenPilot's proven methodology, ZP Reports can typically be added faster since your foundation is solid.
But either way, our team can assess your situation and customize a solution for your needs.
As Andrew said:
"We want to help you gain clarity and visibility into your team so you can serve your clients better and improve your profits."
I learned so much from Andrew during our live session. I'm excited to see ZenPilot empower more agencies with the reporting capabilities they need built right on top of ClickUp.
To get this for your team, don't wait—schedule a call today!
