6 ClickUp Dashboard Examples Every Agency Needs

ClickUp is an incredibly powerful work management platform that can transform how your agency operates. One of the best ways to unlock ClickUp’s potential is by creating custom ClickUp dashboards tailored to your agency’s specific needs.
In this post, we’ll walk through the basics of ClickUp dashboards and then jump in to specific examples for agencies.
An Introduction to ClickUp Dashboards
ClickUp dashboards provide powerful reporting and analytics capabilities, allowing you to gain insights into your workspaces like never before. With customizable widgets (or cards) displaying metrics, graphs, task lists, and more, dashboards make tracking progress and identifying trends easy.
Download the Complete ClickUp for Agencies Guide
The 47-page guide includes graphics, checklists, and links to how-to videos so you can actionize your ClickUp plan.
Get Instant Access →Accessing and Organizing Dashboards
You can access dashboards via the “Dashboards” button in the left-hand menu. And within your dashboards menu, you’ll be able to:
- Favorite dashboards for quick access
- Create new dashboards
- Search for dashboards
- And share dashboards with others
Widget Types and Functionality
Within each dashboard, you’ll have access to movable and resizable widgets (or cards) in a grid layout. Each widget can be expanded by dragging corners to desired sizes.
There are a variety of widget types that you’ll have access to - we’ll discuss specific use cases in our examples below - but here are a few options:
- Graphs plotting changes over time (line, bar, pie, etc.)
- Time reports and time sheets to see time tracked by location, person, and/or task
- Task lists to display a list of tasks
- Embedded widgets to show data outside of ClickUp
- Text blocks to take notes, provide headers, or add in additional notes
- Sprint velocity, burnups, and burndowns to help with sprint planning
- And more!
Each widget can also provide it’s own unique set of filters and settings - offering you advanced customization capabilities to create powerful dashboards and pull data sets from wherever and whenever you need:
- Widgets can pull data from your whole workspace or a specific space, folder, list, task, person, or mix!
- They can also utilize filters to only pull in data with a certain custom field, status, etc.
- And they can reference different time ranges to pull in only the data you need from a certain year, month, quarter, week, or day.
The opportunities for ClickUp dashboards are endless, but it’s important to prioritize what you need so that you don’t get overwhelmed.
6 Dashboards That Every Agency Needs
Now that we have a good understanding of how ClickUp dashboards operate, lets discuss six dashboards that every agency needs to create.
1) Time Reporting Dashboard
The beauty of ClickUp (and a big reason we highly recommend the tool) is they have a very powerful native time-tracking solution.
With the incredible power of ClickUp’s native time-tracking solution, you have the perfect opportunity to visualize this data in a single, centralized location - the time reporting dashboard.
For this to work properly (and actually get the data you want), you need to be working with a proper ClickUp hierarchy and your team needs to have excellent time tracking habits.
With a proper hierarchy, healthy habits, and a little bit a pixie dust (read our ClickUp for Agencies Guide for more on this topic), you’ll be able to see where your agency spends the bulk of it’s time - Growth, Delivery, or Operations? And which client or project you’re spending the most time on.
As discussed in the introduction above, one of the best parts about ClickUp dashboards is that they’re made up of separate widgets that each have their own filters and customizations - allowing you to create simple, but powerful reports.
For example, I can change the date range of each card - do I want to see time tracked this week, this month, this quarter? Or do I want to create two separate cards to compare this months time tracked to last months.
There are endless possibilities, but you’ll want to include these widgets in your time reporting dashboard:
- Time reporting by space - a time report that shows time reporting by space. This offers you the high-level data of where you agency spends most of it’s time - Growth, Delivery, or Operations?
- Time reporting by folder - a time report that provides a great view of which clients (if each client has it’s own folder) are taking up too much time or not enough.
Timesheet - a timesheet that shows you who tracked time, when, and where. You can see the total time for each week and click in to tasks to see the specifics.
- Portfolio - a portfolio widget that gives another look into progress, statuses, time tracked, and estimated by lists (or client service lines and projects - more on this in our ClickUp for Agencies guide).
Overall, this dashboard offers a birds-eye view into time tracked across the organization.
2) Time Estimated vs. Actual Dashboard
To get realistic workload planning, your teams need to add time estimates to every task in your system.
And the more accurate your time estimates, the better visibility you have into team capacity - enabling better project planning and preventing burnout.
In addition to a basic time reporting dashboard, you’ll also want one to compare time estimates to actual time tracked. This helps you spot trends and see where estimates were way off - enabling you to improve your time estimates, and continuously improve your workload management view.
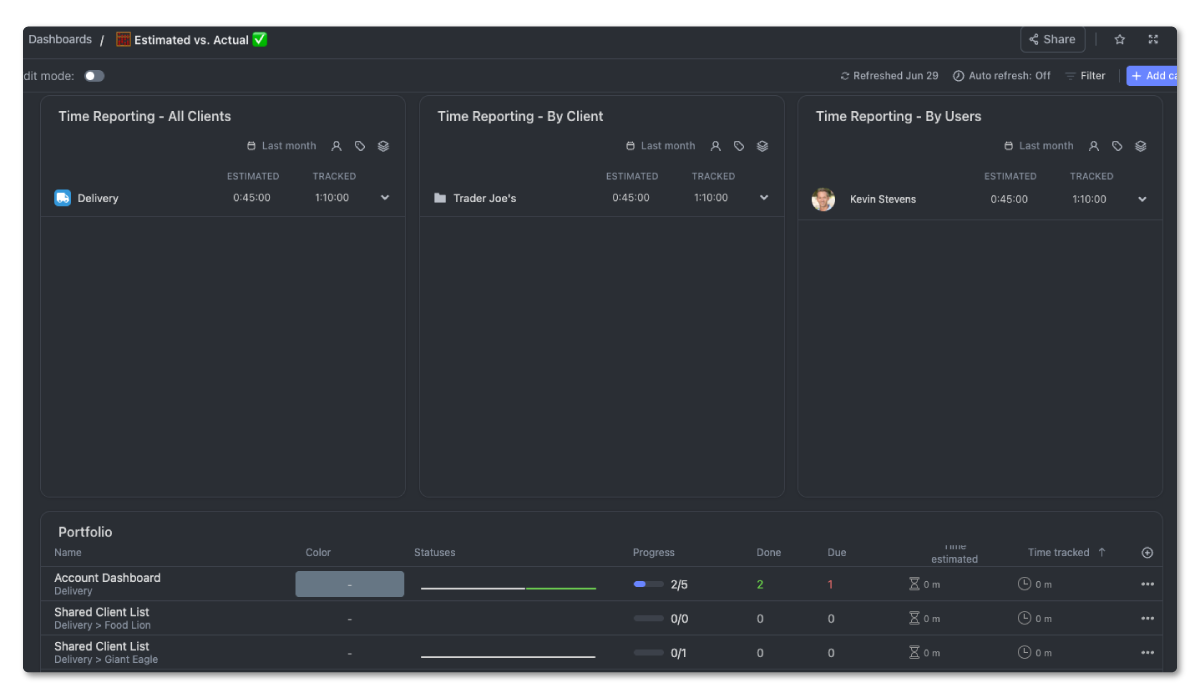
This dashboard should include a variety of time estimate vs. actual widgets:
- Time reporting by space - this provides visibility into which areas of the business have the largest time discrepancies.
- Time reporting by client - this provides visibility into which clients have the largest time discrepancies.
- Time reporting by users - this provides visibility into which users and tasks have the largest time discrepancies.
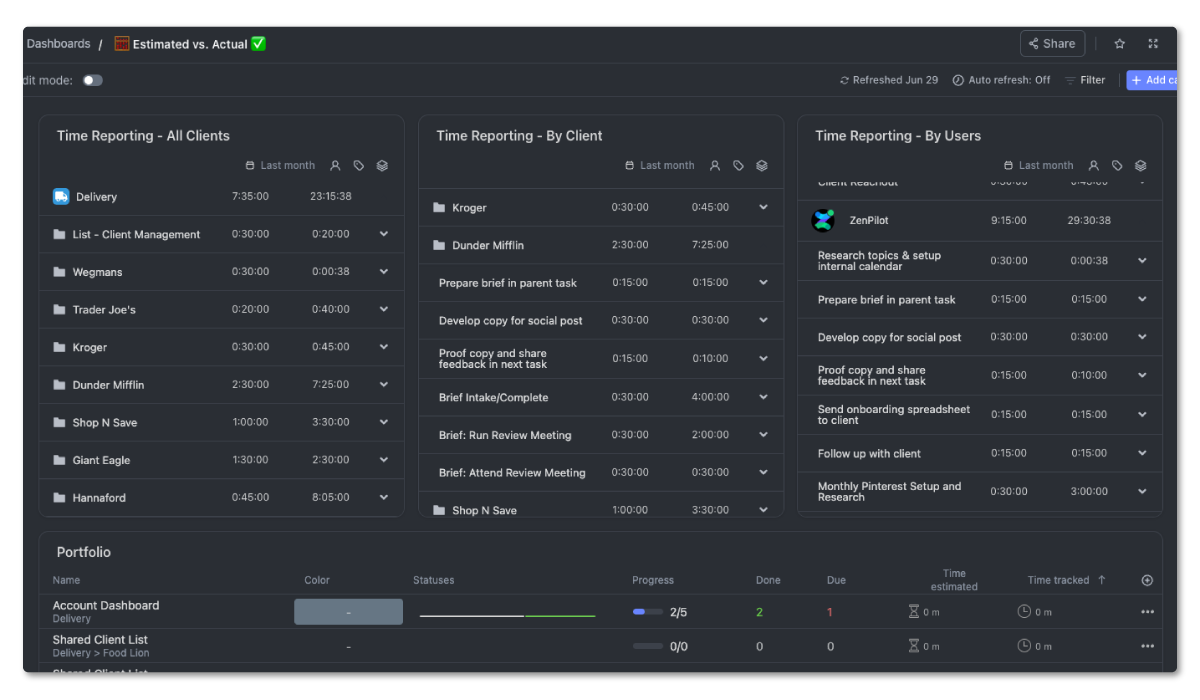
From here, you’ll be able to click into specific tasks to understand why the estimate was off and potentially follow up with the assignee. If we find certain tasks consistently take more or less time, we can update our process templates.The goal is to make time estimates as accurate as possible. This gives project managers and resource planners real data to base workload decisions on.Below these three main widgets you’ll have a few additional areas to look at task lists and portfolio-level estimates and actuals. This helps identify trends, overloaded teams, and tasks with bad estimates.
3) ClickUp Champion Dashboard
ClickUp Champions are the glue that holds your ClickUp workspace together.
They are responsible for training your team, holding the team accountable, and promoting healthy habits in ClickUp. This dashboard is their central hub to do their job - understanding what’s happening across your ClickUp workspace and taking action to keep the system clean.
The Champion should check their dashboard daily, weekly, and monthly to spot issues, coach teammates, and celebrate wins.
This dashboard should include:
- A chat widget for teammates to ask the Champion ClickUp related questions
- Task lists to monitor task health metrics - assignees, due dates, and time estimates
- A time report to understand who is and who isn’t tracking time
- A task list of close tasks that are missing crucial data - time estimates, due dates, and assignees
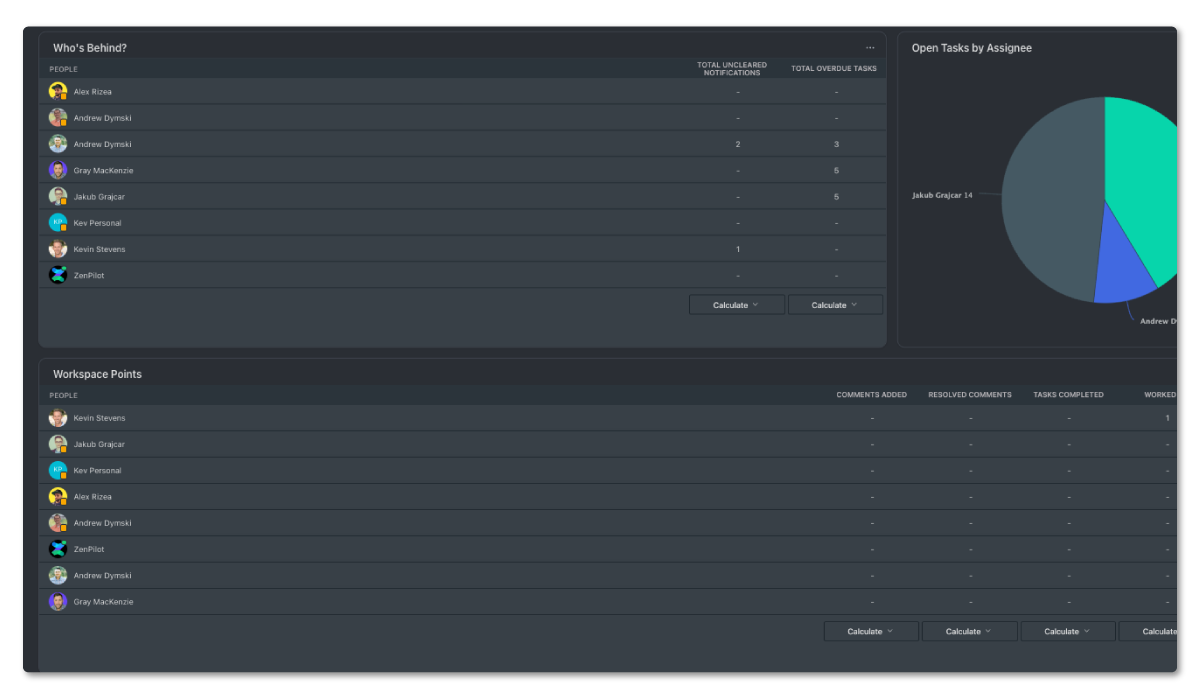
- A “who’s behind” widget to monitor poor ClickUp habits - overdue tasks and uncleared notifications
- A “workspace points” widget to track team performance and celebrate team members who are performing well
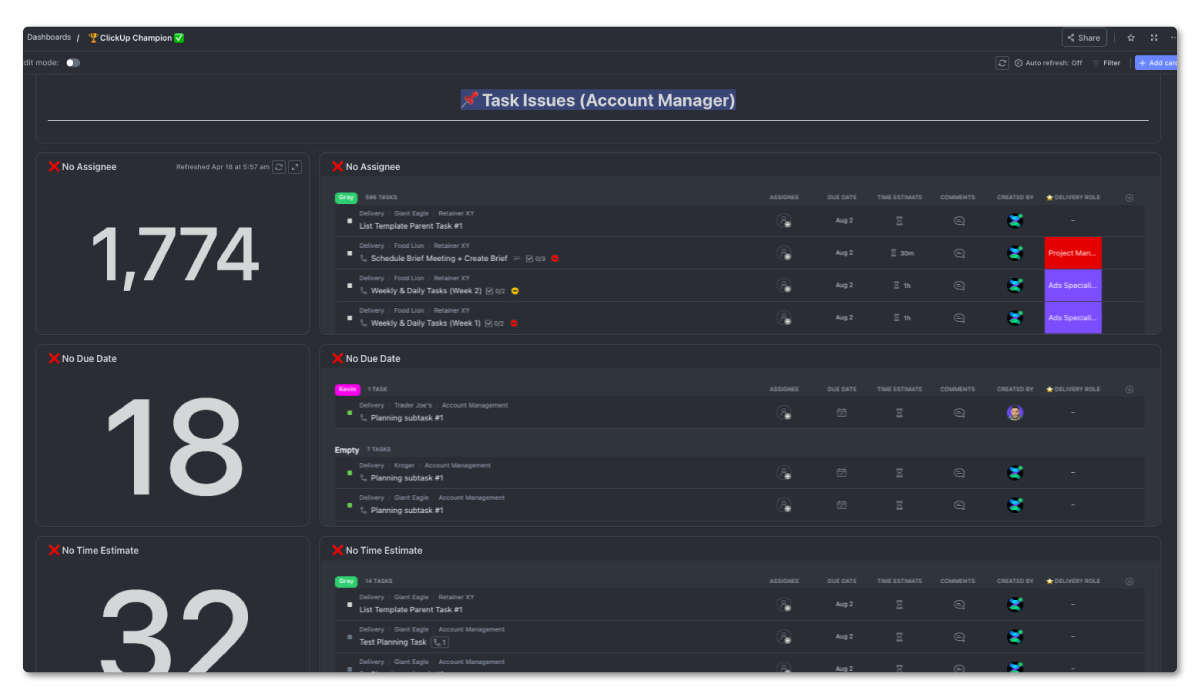
The most important element is the task health section. Every task should have an assignee, due date, and time estimate. This provides the data needed for workload planning.
The Champion should be able to quickly see which tasks lack assignees, due dates, or estimates and they can notify the relevant team members to fix these issues.
4) Personal Dashboard
Giving individual contributors a detailed list of their work can dramatically influence productivity and utilization. When someone knows exactly what they have to do today, tomorrow, and in the future, they’ll complete a lot more work.
Though every user should have a dedicated “My Tasks” view, creating a personal dashboard for everyone provides individuals with a holistic and detailed perspective of their work.
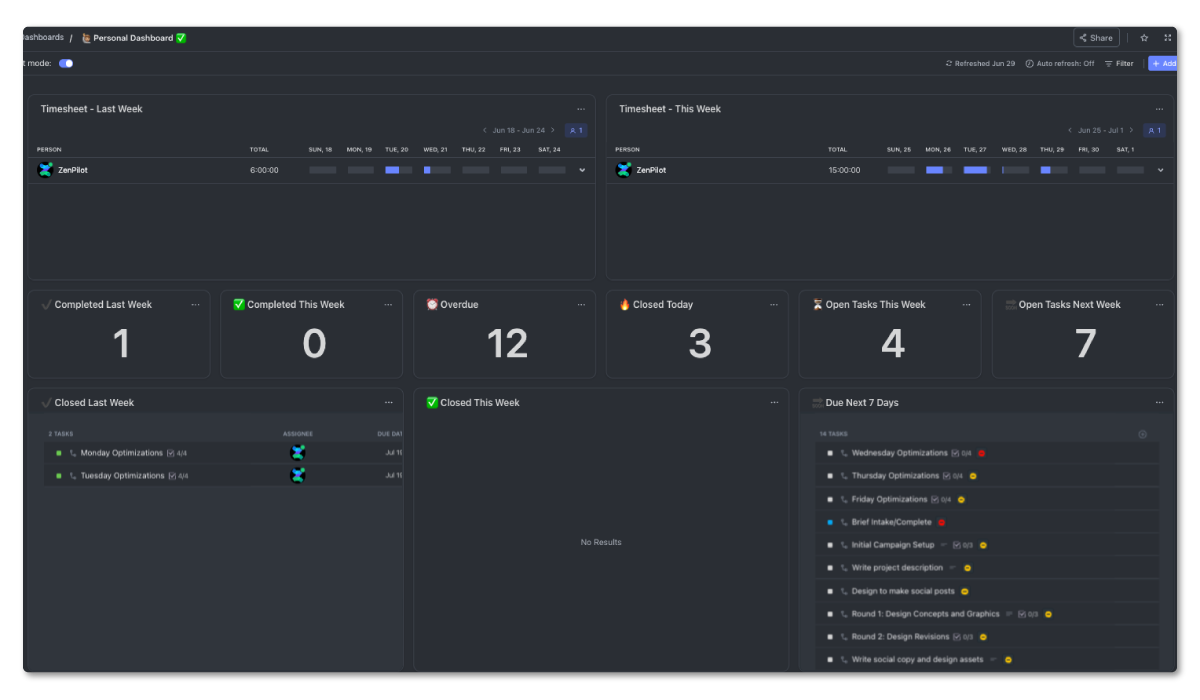
This personal dashboard should include:
- Timesheets from this week and last to help them quickly check if they missed any time entries.
- Calculation widgets to show completed tasks by week - showing them their progress and accomplishments each week.
- Task lists with overdue work to show them what work they need to prioritize.
- Tasks lists with upcoming tasks to show them what’s coming up on their to-do list.
This dashboard can be created separately for each user or you can leverage the “Me Mode” functionality to dynamically adjust the dashboard based on who is logged in. Though this does sound great, I’d lean towards creating a unique dashboard per user in case they have some additional customizations they’d like to make.
5) Internal Client Overview Dashboard
Your team needs an overview of everything that’s happening for a specific client, right?
There are views that can also be created to get a lot of this information, and I’d recommend pairing this with an account dashboard, but creating a client dashboard can be extremely helpful for account and project managers monitoring progress, tasks, and client deadlines.
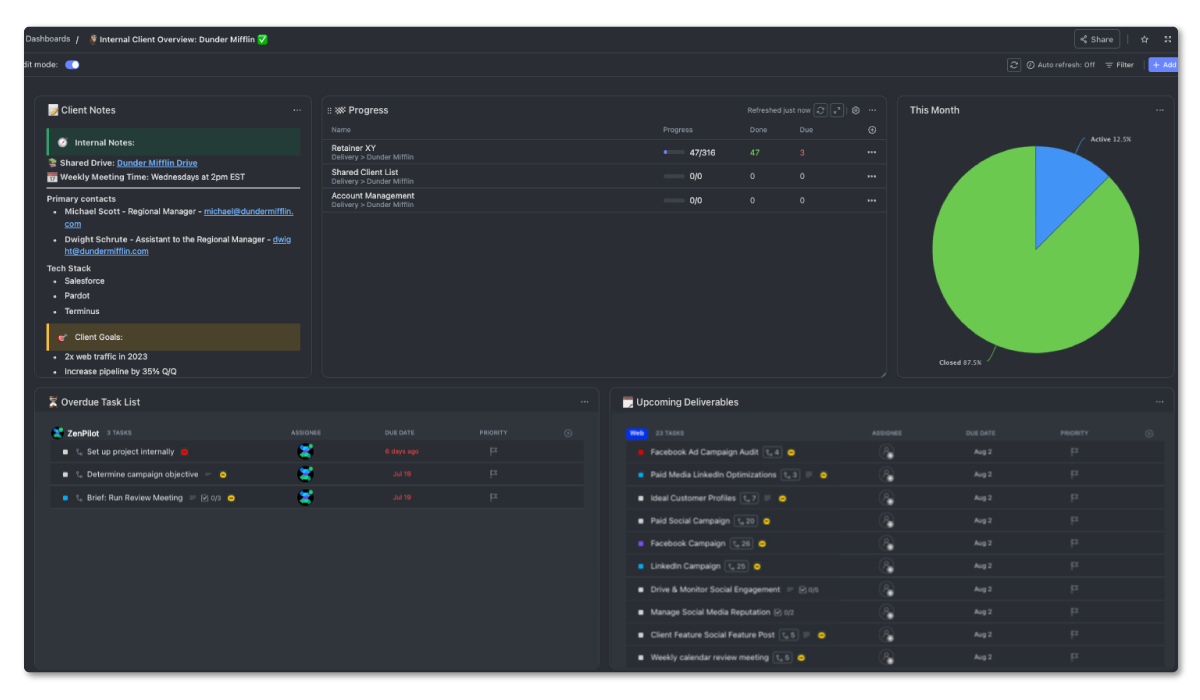
This dashboard should include:
- A text block to document client background, goals, contacts, and meeting times
- A portfolio widget to track project progress and overdue tasks
- A pie chart to show high-level task status progress
- Task lists for both overdue tasks and upcoming deliverables
- Time reports and calculation widgets to provide a glimpse into time estimated and time tracked
- And an activity widget to centralize communication across the clients deliverables and projects.
Having this single source of truth makes it easier to spot bottlenecks, gaps, resourcing issues, and more. It gives your client teams the visibility needed to proactively manage accounts. If your agency is also tracking leads and deals in ClickUp, you can build similar dashboard views for your sales pipeline - see our guide to lead tracking in ClickUp.
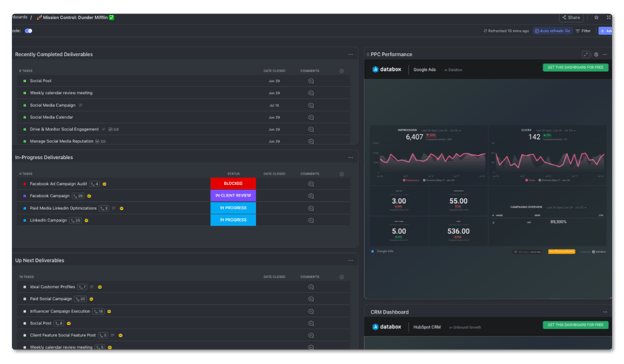
6) Client-Facing Dashboard
Providing your clients visibility into upcoming deliverables, completed deliverables, and results is a massive benefit from an organized project management system.
ClickUp dashboards can be created for clients to provide them with an automated view of what you’re doing for them, when it’ll be complete, and the results from your work. So, rather than you having to tell them everything via email, you’ll create one-spot for them to go to see everything!
This client-facing dashboard should include:
- A task list displaying recently completed deliverables
- A task list displaying deliverables currently in progress
- A task list displaying upcoming deliverables in the pipeline
- And embedded reports (from a provider like Databox) to show them campaign results, ad performance, lead metrics, and more.
This ties your work directly to business outcomes, demonstrating your value. Internal marketing teams can use similar client-facing dashboards to report campaign performance to internal stakeholders.
**
**
Notes, documents, contact forms, and other widgets can also be incorporated to create a seamless client portal.
The only downside to client-facing dashboards is that you can’t make them “fully public” like you can a view inside ClickUp. Instead, you’ll need to invite client users as Guests into ClickUp. Then share the dashboard with their accounts.
An alternative to a client-facing dashboard is to create a client portal using public views and a public document.
Get Started Creating These ClickUp Dashboards to Supercharge Your Agency
These six dashboards provide incredible visibility into your agency’s work and productivity when built properly in ClickUp.
However, remember that the dashboards are only as good as the data behind them.
To get the most out of these reporting tools, focus first on establishing consistent time tracking habits, nailing down processes, and creating an organized ClickUp structure.
Download the Complete ClickUp for Agencies Guide
The 47-page guide includes graphics, checklists, and links to how-to videos so you can actionize your ClickUp plan.
Get Instant Access →Garbage in leads to garbage out.
By combining well-structured data with customized dashboards, you gain the insights needed to manage clients, forecast work, and optimize performance. That clean structure pays off with AI too - our guide to ClickUp AI shows why Brain is only as useful as the workspace data behind it.
Frequently Asked Questions
What are ClickUp Dashboards?
ClickUp Dashboards are customizable reporting pages made up of widgets (cards) that display metrics, charts, task lists, time reports, and other data from your workspace. They give agencies a centralized view of team performance, project progress, and client health - all in one place.
How many dashboards can you create in ClickUp?
The number of dashboards you can create depends on your ClickUp plan. Free plans are limited to a small number, while paid plans (Unlimited and above) allow significantly more dashboards. On the Business plan and higher, dashboard limits are generous enough that most agencies won’t hit them.
What should agencies track on their ClickUp Dashboard?
Agencies should track team utilization, overdue tasks, client health, and project profitability. A solid dashboard setup includes time reporting (tracked vs. estimated), task health metrics (missing assignees, due dates, or time estimates), workload distribution across team members, and a client overview showing deliverable progress and deadlines.
Can clients see ClickUp Dashboards?
Yes, but only if they are invited as Guest users in your ClickUp workspace. Dashboards can be shared with specific Guest accounts on the Business plan and above. If you want to give clients visibility without inviting them into ClickUp, you can use public views or build a client portal with shared documents instead.
Want Help Building Dashboards Your Team Will Actually Use?
Dashboards are only as good as the structure and habits feeding them, and that’s where most agencies get stuck. Pretty widgets sitting on top of messy data don’t help anyone make decisions.
That’s the job at ZenPilot. We look at how your team runs ClickUp today, show you exactly what to fix, and help you roll out the fixes (dashboards included) in a way your team will adopt instead of ignore.
If you want that kind of look at your workspace, book a free 30-minute call. Worst case, you leave with a clearer picture of what to fix first.