
The State of
Agency Operations 2026
What 4,321 agency team members at 466 companies told us about how their work actually gets done. Fourteen agreement statements, eight open questions, and roughly 21,700 written answers.
Every response was collected at the start of an engagement with ZenPilot, during the Blueprint. This is what agency operations look like before.
believe their clients are lucky to be working with them
trust that things don't slip through the cracks
We call it the Confidence Gap. It's the story of this report.
The Confidence Gap
Agency teams believe in their work. They don't trust their systems.
Ask people whether their agency does great work and the numbers are overwhelming. 90% agree they deliver services that drive meaningful results. 88% say their clients are lucky to be working with them. 84% would recommend their workplace to friends.
Then ask whether they trust the machine behind that work. Fewer than half agree their tools are organized and up to date. Only 41% believe things don't slip through the cracks. Only 39% say they have a system for measuring client satisfaction.
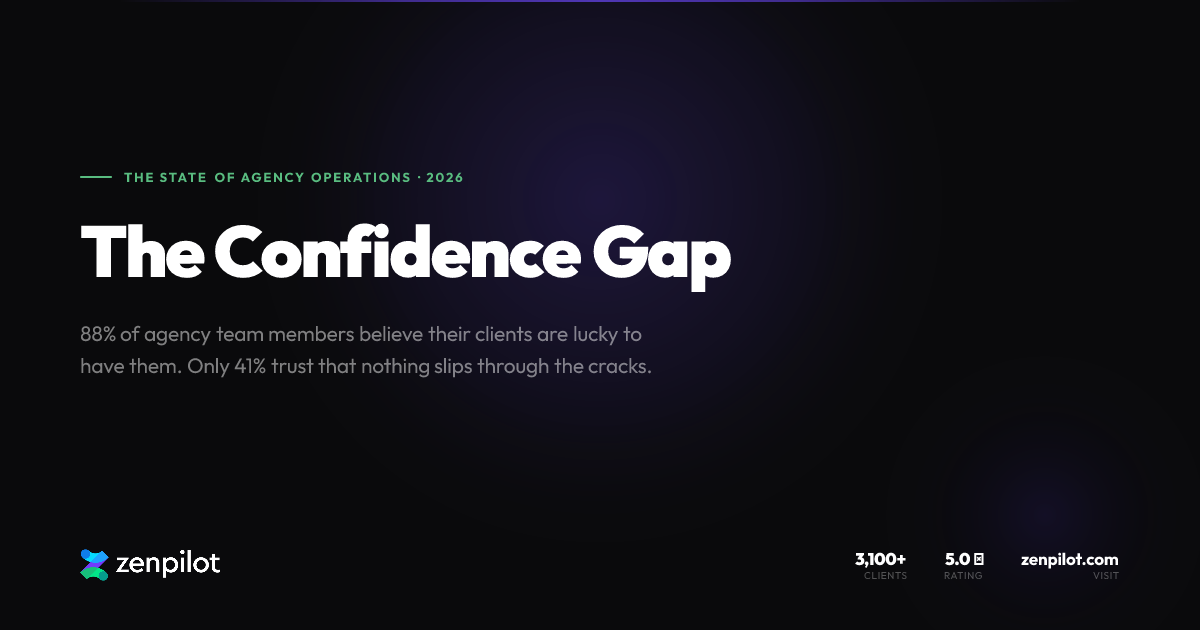
That's a 47-point gap between how good teams believe their work is and whether they trust it to happen reliably. Great people, proud of their work, running on systems they know are failing them.
The full picture
Percent agreeing hides the shape of the answers. Here's the full 1-to-5 spread on four of the statements.
Notice the shape. "I know what I need to complete each day" piles up hard on the right - people have their own act together. The system statements sag toward the middle and left. That contrast is the whole report in one chart.
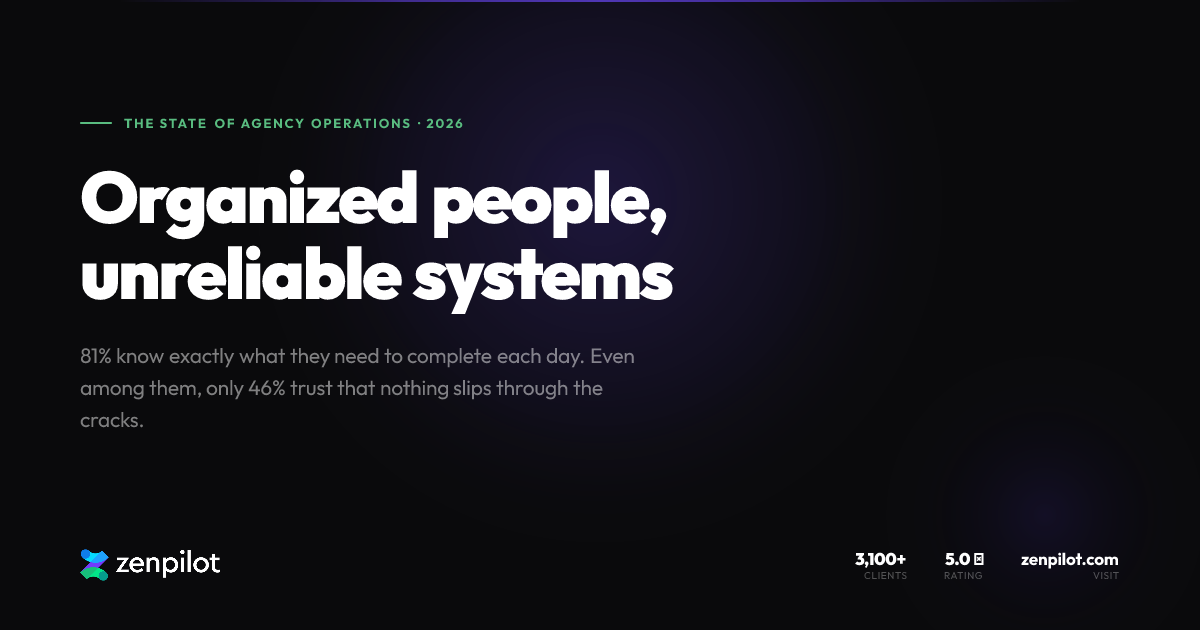
of respondents know what they need to complete each day. Personal organization is the one part of operations agency people have already solved.
of that organized majority trust that nothing slips through the cracks
among the people who don't know their day
Personal organization can't fix a system problem.
Every chapter that follows is a different view of that same gap.
A Day in the Life
Follow one respondent through a single workday and the gap shows up everywhere. It starts before the first task is even opened.
Email is the front door to the workday
Out of 2,880 answers about morning routines, 764 mention email against 688 for ClickUp, and far fewer for every other PM tool. 310 people, 11% of respondents, explicitly start their day in the inbox. A dozen literally use the inbox as their task list.
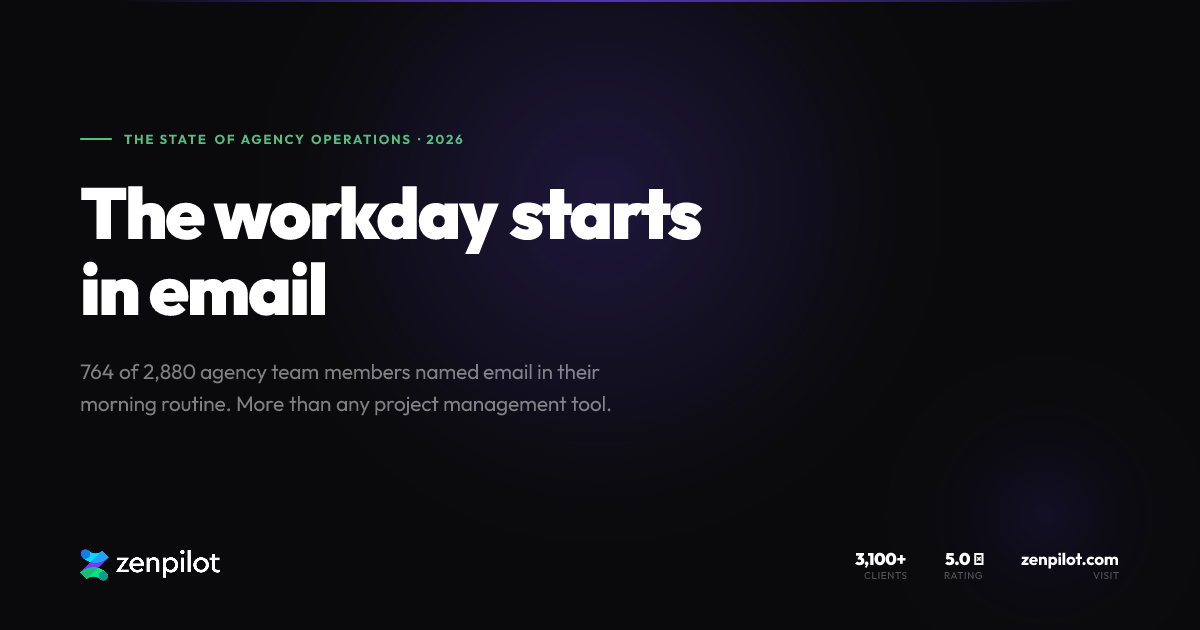
And it's trending the wrong way. Email's share of morning-routine answers grew from 23.4% in the earliest third of responses to 29.1% in the latest. The end of the day looks the same: email is the most-mentioned end-of-day tool too, at 365 mentions vs 300 for ClickUp and 200 for Slack.
“I currently use my Inbox as my To Do list”
One in four runs the day from a shadow system
Roughly 1 in 4 respondents assembles a private list every morning - a Google Doc, Apple Notes, a spreadsheet, a notebook - and works from that instead of the official tool. 290 answers explicitly describe a personal system outside the company PM tool.
answers describe running the day from a notebook, sticky notes, or paper
Why do shadow systems win? Trust. People keep private lists because the official one is cluttered or stale. And it runs top to bottom: owners and CEOs admit their own work lives in their head or a bullet journal. The people enforcing the system aren't in it either.
“I ignore ClickUp entirely (as I don't understand it/it isn't reliably up-to-date) and go from working head knowledge.”
“people tend to go a bit rogue with their spreadsheets, which sometimes link to other spreadsheets or docs, and it just turns into this weird Byzantine rabbit hole”
The shadow-system penalty
The workaround is a symptom, not a quirk. Respondents who run their day from paper or a personal list score their systems dramatically lower than everyone else.
The morning scavenger hunt
The day's plan doesn't live anywhere. It has to be reconstructed every morning from fragments: PM tool, email, Slack, calendar, spreadsheet, paper.
check two or more places every morning to assemble their day
check three or more
If the first 30 minutes of every day goes to assembling the plan, a 20-person team loses about 2,400 hours a year to the scavenger hunt - before any actual work starts.
30 minutes a day × 20 people × ~240 working days = ~2,400 hours
“As soon as I have a moment left for something else, I spend more time looking for a task than doing it.”
The 5pm decision
Every day ends with the same question: what happens to the work that didn't get done? For most teams, the answer is tomorrow's problem. 36% of end-of-day answers describe rolling unfinished work forward. Only about 2% mention staying late. Rescheduling, not grinding, is the dominant coping strategy - which explains why due dates decay into fiction. As one respondent put it, most deadlines are treated as soft unless there's a client presentation scheduled.
“Just be stressed about it and know I have to do it tomorrow.”
“the day never ends, it blends into the next day”
“Get out alive”
Why Work Slips
We asked why deliverables end up missed or late. 2,725 people answered. Nobody blamed the software alone.
Two things stand out. First, almost nobody says "understaffed" - just 6 answers out of 2,725. People frame overload as a planning failure, not a hiring failure. They don't want more coworkers. They want visibility into who's actually at capacity.
Second, only 5% claim tasks rarely slip at all.
Clients are the co-villain: they show up in 24% of all answers, mostly as late approvals, late feedback, and missing assets.
“We are stuck in the rut of (almost) everything is needed ASAP and if everything is a rush, nothing is a rush.”
Notifications - the feature designed to prevent misses - are a named cause of misses in 69 answers. Alert floods train people to ignore alerts. One respondent summed it up: "Today, many team members view ClickUp notifications as noise rather than actionable information."
The Slack Paradox
Slack is simultaneously the hero and the villain of agency operations.
Ask what's working in internal communication and Slack crushes it: 651 mentions vs 148 for ClickUp. That's a 4.4x margin. Ask what needs improving and Slack tops that chart too, with 355 mentions - tasks assigned in chat with no record, decisions buried in threads, context that never reaches the task.
mentions of Slack when we asked what's working in internal communication. ClickUp got 148.
mentions of Slack when we asked what needs improving - the most-named tool on that list too.
The most-celebrated "best practice" in the dataset is the double notification: update the task, then ping Slack about it. Teams describe it proudly. It's really an admission that the system of record is too slow to be trusted on its own.
“If we want a fast reply to a problem or a question, we use Slack because Click Up replies can take hours/days. Slack replies take roughly 2-3 minutes.”
“Too much communication happens outside of tasks; either in a client folder's group chat or in a bazillion combinations of group pings.”
Meanwhile, email is functionally dead inside agencies - it shows up in just 4.4% of internal-comms answers - while dominating the client-facing workday. Two different worlds, one team.
Hero Culture Is Operational Debt
Asked what's working well in project management, 18% credited communication. A striking sub-genre credited pure human effort. Not the process. Not the tool. Effort.
“Now everything is manual & very human-related. Feels very much a hero-culture, not a system-culture.”
“The general feeling from team members of our current system is one of 'treading water.' Every day there is a low-grade panic that if just one thing goes wrong, it will throw off our day and subsequent days.”
“through a lot of manual work, the ongoing work is getting done and delivered to the clients but that's through sweat and tears!”
“I'm a sh*t show. I don't do this well at all. I recognize deadlines and scramble at the end to get it done. I don't do a good job of seeing stuff before it becomes a fire.”
“We have growing pains. What worked when the agency was 6 people is not working when we have 20.”
The most common caveat attached to every tool in the dataset: "works well when used properly." Or as one respondent put it, it's "a people problem, not a product feature problem."
Here's our read. Hero culture is unbilled operational debt. Talented people overcompensating with communication and manual effort will keep clients happy for a while. It works right up until your best people leave, get sick, or the team grows past what heroics can cover. The 6-to-20 breaking point shows up in this dataset over and over.
Does this sound like your team?
- Your to-do list is your inbox.
- You keep a private spreadsheet or doc nobody else can see.
- Everything is marked urgent, so nothing is.
- You update the task, then ping Slack about it anyway.
- Deadlines are soft until a client meeting looms.
- The first 30 minutes of every morning goes to figuring out what to work on.
Each of these showed up hundreds of times in the data. None of them is a people problem. See where your team stands with the free PM Benchmark.
What Reliable Teams Do Differently
Across 2,893 complete responses, we correlated every statement against "things don't slip through the cracks." The strongest predictors aren't about talent or effort. They're about structure.
Execution reliability is a workspace-structure problem before it's a people problem. Organized tools, documented process with accountability, a real system for client satisfaction, and focused meetings - that's the profile of teams where work doesn't slip.
And it flows through to retention. At companies in the top decile of operations scores, average agreement with "I'd recommend this workplace to my friends" is 4.69 out of 5. In the bottom decile, it's 3.98.
Focused meetings ripple outward
Cut the data by a single habit and the splits get stark. People who rate their meetings focused and productive report a different company: work slips less, and they're far more likely to recommend the place.
Process discipline is visible to your clients
The same split shows up on the client-facing side. Teams with documented process and accountability set healthier client expectations and actually measure satisfaction. Your clients can tell whether your house is in order.
plan tomorrow the night before, or plan the week on Friday. It's the most in-control cohort in the whole dataset - the only group that starts the morning executing instead of reconstructing.
Teams want more structure, not less
One more thing the data killed: the idea that teams resist structure. The final open question skewed 5:1 positive - 184 praise mentions against 35 mentioning stress or burnout - and its most common substantive word was "process," at 275 mentions, ahead of any tool. Individual contributors ask for more accountability, including on themselves.
“I know I'm a weak link in the processes and consistency departments and need a system that can keep me accountable”
“We all have the same mantra: If it's not in ClickUp, it doesn't exist.”
The AI revolution hasn't reached daily operations
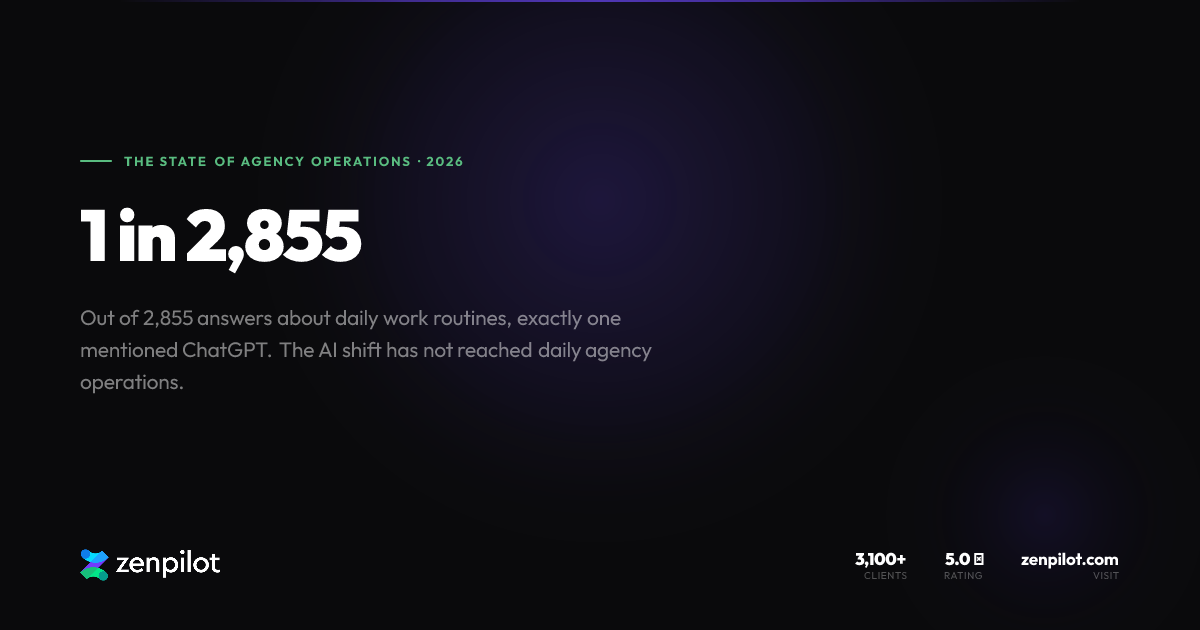
Across 2,855 end-of-day answers, exactly one mentions ChatGPT. One. In the question about operational challenges, AI is essentially absent.
Whatever AI is doing to pitch decks and marketing copy, it has not touched the daily operating routines of agency teams. They still start the day in the inbox and end it rolling work to tomorrow.
Read that as opportunity. This is the open frontier of agency operations: the first teams to wire AI into how work actually runs - capacity, handoffs, follow-through - are competing against teams that haven't started.
Every dot is an answer. One mentions AI.
Methodology
How this data was collected, counted, and where it's biased. We'd rather tell you plainly than pretend this is a random sample.
Who we surveyed
Respondents are team members at agencies undergoing ZenPilot operations assessments. That selection biases toward teams that felt enough pain to seek help. Keep that in mind when reading the numbers - though in our experience, the teams that never measure are rarely doing better.
What we asked
14 Likert statements on a 1-5 agree scale, plus 8 open-text questions. In total: 4,321 responses from 466 companies, roughly 21,700 written answers, and about 3 million characters of text.
When teams take it
At the very start of their engagement with ZenPilot, during the Blueprint - before anything has been fixed. Read every number in this report as the before picture. The only longitudinal claim we make is the email trend, comparing the earliest third of responses to the latest third.
How we counted
Likert percentages are exact. Percentages on open-text themes are keyword-count grounded approximations, with the underlying counts shown alongside them throughout the report.
Quotes
All quotes are verbatim, stripped of names, companies, and email addresses. Grammar left as written.
Sample sizes
n varies by question: 2,725 to 2,893 for open-text questions, 4,321 total Likert rows, and 2,893 responses complete across all 14 statements. Each chart notes its own n.
You've just read the before picture
Every response in this dataset came in at the start of an engagement with ZenPilot, before anything was fixed. Teams that re-take the survey later in their engagement improve dramatically, often within the first three months of working with ZenPilot. That's the after picture, and we'd love to show you yours.
Book a CallWant the fix itself? Start with the Blueprint. Or benchmark your team against this dataset with the free PM Benchmark.
Prefer a PDF? Download the report.